


Suunto Blog

Training with TSS and hrTSS
What are TSS and hrTSS and how can these training metrics help?
One of the best ways runners and cyclists can constantly improve is by having a solid understanding of their training data. It’s trying to tell you something, but you can only understand if you speak its language.
Whether you are a triathlete, cyclist or a marathoner, TSS and hrTSS are two training languages well worth getting your head around. TSS is probably the most used training load algorithm amongst endurance athletes. It tells you how hard your training session was and the physical stress of your training over time. TSS is dependent on training with power, and ideal for cyclists, while hrTSS is an alternative for those training without power, and can be helpful for runners and other endurance athletes, such as cross-country skiers.
The partnership between Suunto and TrainingPeaks was formed to give you full command of your training data. You track your workouts with your Suunto watch and TrainingPeaks gives you in-depth analysis and planning tools to achieve your full potential. After each activity, you can analyze your heart rate, power, pace and other data to determine where you are at. (Read more about benefits you get with Suunto & TrainingPeaks.)
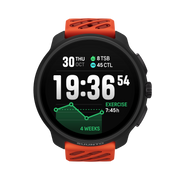
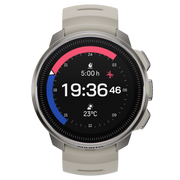
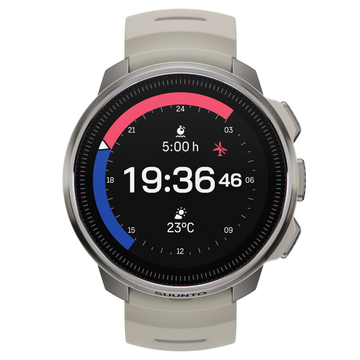
On Suunto 9 and Suunto 5 watches you are able to follow TSS and hrTSS in real-time. This lets you adjust the effort and duration of the exercise on the go, helping you reach your goal. TSS, hrTSS and other TrainingPeaks features can be accessed in the SuuntoPlus section of Suunto 9 and Suunto 5 watches.
You can have all the technology in the world, but to get the most of your training, your Suunto watch and TrainingPeaks, it’s worth the time getting a clear understanding of these two training metrics: TSS and hrTSS. So get yourself a coffee, sit back and read on.
Why bother with metric-based training?
The primary goal of a metrics-based approach to training is to understand what the body is undergoing from a physiological perspective, and how that ultimately influences training decisions. Understanding the stress that training puts on the body’s systems, and whether or not the desired response is being produced is integral to the modern training process. Understanding what both TSS and hrTSS are allows for a deeper discussion of the two and their merits.
What is TSS?
First things first, you need to understand TSS. Specially designed for cycling, the Training Stress Score metric tells you how much stress your body underwent on a ride. It’s a composite number that takes into account the duration and intensity of a workout to score the overall training load and physiological stress created by a training session.
By taking both intensity and duration into account, TSS allows for a better understanding of the “cost” of every individual effort and workout. TSS is calculated using the following formula:
TSS = (sec x NP x IF) / (FTP x 3600) x 100
Where “sec” is the duration of the workout in seconds, “NP” is Normalized Power, “IF” is Intensity Factor, “FTP” is Functional Threshold Power, and “3,600” is the number of seconds in an hour.
It’s worth defining and understanding this equation so you have an idea of why TSS is so accurate, and how the final score is derived. The components that comprise TSS are what make it so useful to athletes.
Normalized Power is calculated using an algorithm that is a little complex, but in a nutshell takes into account the variance between a steady workout and a fluctuating workout. It measures the true physiological demands of a training session. It considers both rapid changes in intensity, as well as critical responses in the body associated with those changes.
Unlike average power, Normalized Power is the power your body “thinks” it employed based on the variability of the workout. Intensity Factor (IF) is the ratio of Normalized Power to Functional Threshold Power (FTP). IF takes into account differences in fitness within or between individuals.
It’s a great way to track fitness over time for a given effort, for example the same ride with a lower IF indicates increased fitness. Using TSS provides a well-rounded look into both the physiological expenditure of an effort, as well as what that effort means for the fitness and progression of an athlete.
What is hrTSS?
More appropriate for those not training with power, the Heart Rate Training Stress Score (hrTSS) is based on time in heart rate training zones derived from an athlete’s lactate threshold heart rate. The calculation is made using an estimate of the amount of accumulated TSS in an hour given the level of exertion.
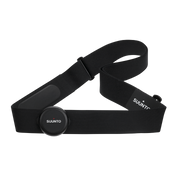
Suunto watches use intensity zones where HeartRate Zone 4 | Zone 5 limit equals the lactate threshold / an-aerobic threshold level. The hrTSS in Suunto watch uses this level to calculate the proper TSS value. You can find the heart rate zone setup on your watch settings: Training » Intensity zones.
It’s important to remember that Functional Threshold Power (FTP) is by definition 100 TSS per hour. This makes intense, or hypervariable efforts hard to account for given the limitations of the body’s cardiovascular system to respond rapidly enough to changes in intensity.
hrTSS is used as the default in TrainingPeaks when there is not enough data to calculate TSS, rTSS (Run Training Stress Score) or sTSS (Swim Training Stress Score). It can be accurate, depending on the effort, but doesn’t do as good of a job at incorporating intensity and duration into the equation.
Comparing the relative merits of TSS and hrTSS
If you’ve not yet taken the jump into training with power, there is some value in hrTSS. The best way to use hrTSS is with steady state efforts, such as long tempo and sub-threshold work.
These types of efforts suit the hrTSS formula because there are no abrupt changes in intensity. It’s easier to estimate hrTSS when the heart rate stays steady for longer periods of time. This metric begins to fall away when shorter and more intense efforts occur. The heart doesn’t respond rapidly enough to weight efforts above threshold.
This makes the “cost” of the workout seem much lower than it really is. While hrTSS may be recording a more moderate range, you’ll feel much more tired given that you’ve stressed systems in the body that hrTSS couldn’t pick up on.
TSS is the best way to ensure you have a good understanding of how taxing a particular effort or workout was. By incorporating Normalized Power into the equation, we get a much more accurate sense of the effort the body actually produced.
Picking up on these fluctuations in effort also allows for a much more accurate TSS reading. This not only is helpful in understanding a single workout, but influences core metrics such as Fitness, Form, Fatigue and ramp rate.
A more accurate Training Stress Score not only means you’ll have a better understanding of your workout, but you will likely also have a more productive approach to your planning, recovery, and execution.
The metrics that we have at our disposal help to inform our workouts, as well as help to execute them with a greater level of precision. Knowing how the metrics we rely on are calculated, and why it is we should trust one more than the other is important for any athlete.
TSS provides the most accurate picture of how both individual sessions and specific efforts impact the body. While hrTSS can help to quantify steady state efforts, it does not do a good job of highlighting the often stochastic nature of exercise. Using TSS will lead to more accurate planning and a better understanding of each workout.
READ MORE
View TSS and other power-based cycling metrics in real-time
3 TrainingPeaks training metrics to adjust your running on the go
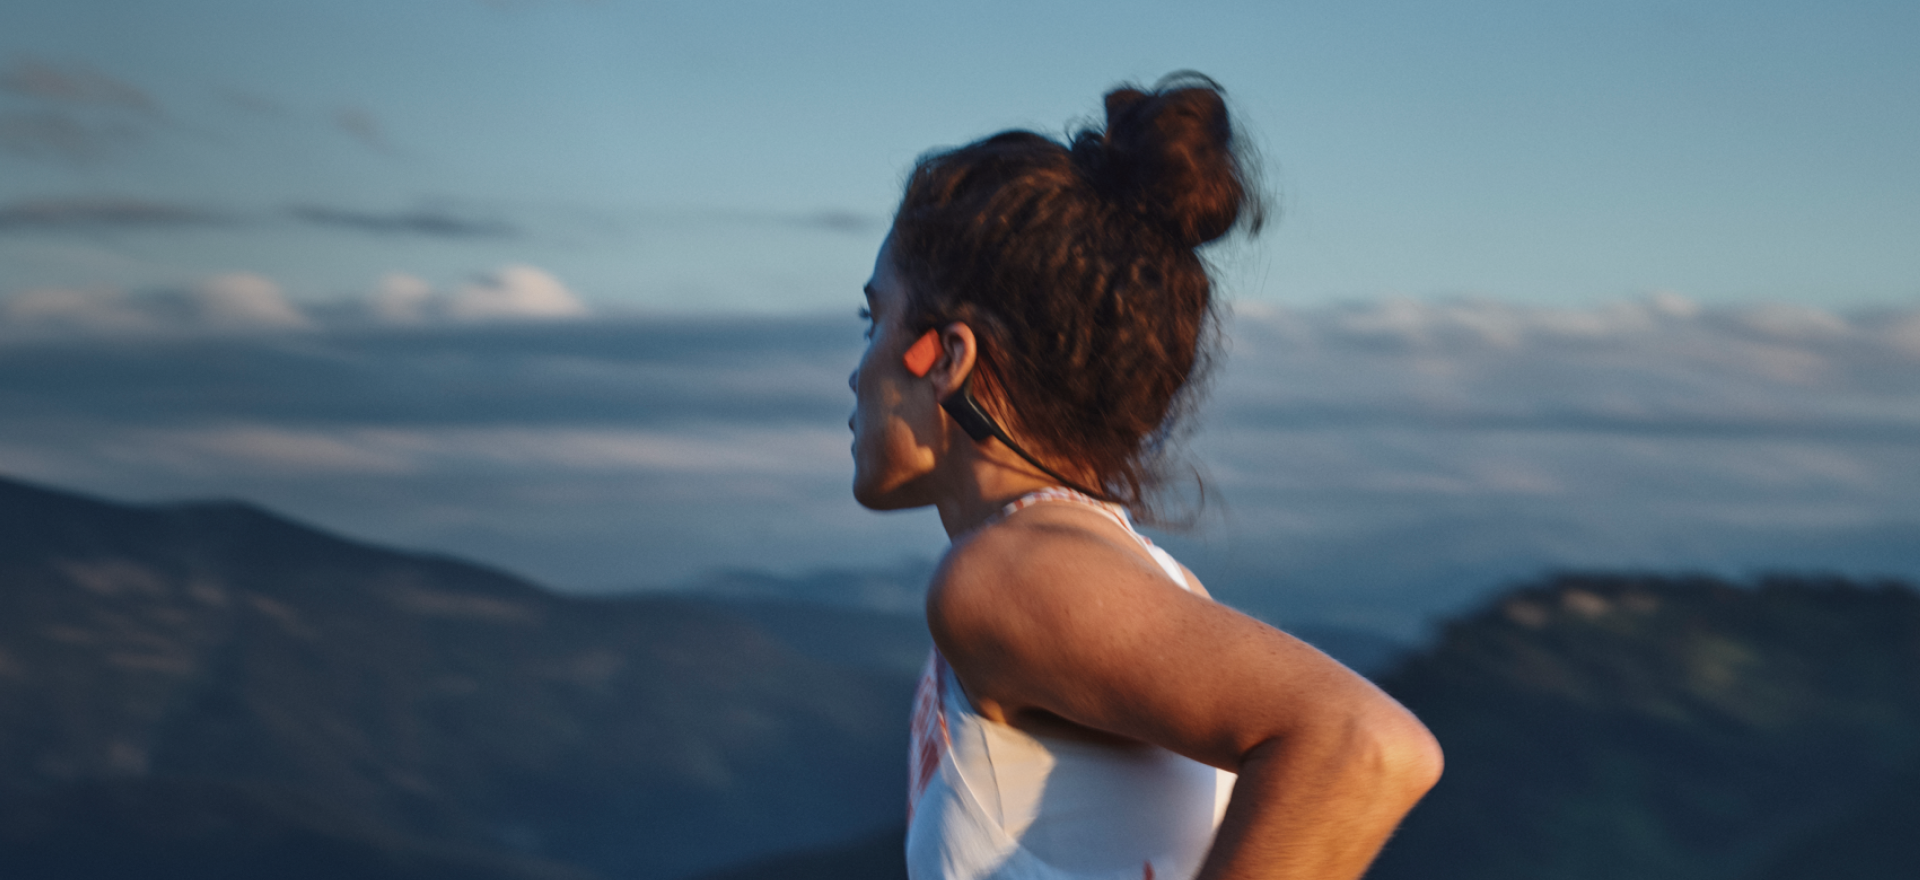
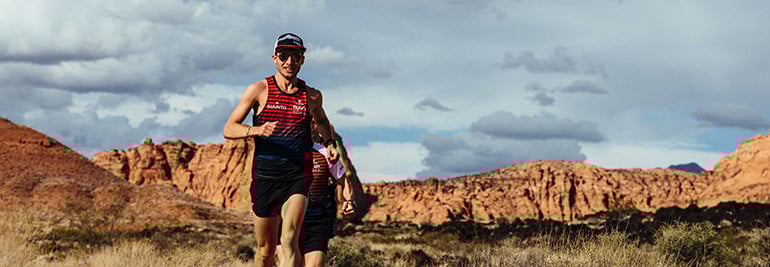
Lead image: Kevin Scott Batchelor


World Vertical Week 2020 Big Data: The nation that climbed the most is …
The data for 2020 is in! Our data nerds crunched the numbers and worked out who gets kudos.
Well done to everyone who got out there and chased vertical meters over World Vertical Week 2020. We saw some inspiring efforts from people around the world.
Two firefighters, for example, donned their heavy protective clothing and gear, and powered up and down the best training hill in their hometown of Helsinki, Finland. That’s going above and beyond the call of duty! Read their and two other cool stories from the week here.
At Suunto HQ we are always excited to analyze the data and see how much our users have climbed over the week, and which nations and sports have sweated it out and gathered the most vertical meters. This year week has some exciting results.
Over time, World Vertical Week has gradually been becoming a tradition; more and more people are participating and sharing their love of moving uphill.
Return to the top
Last year, one of the surprise results was that Austria lost it’s top place as the nation that gains the most vertical meters by average after holding it for two years. This year, the alpine nation has retaken the throne. The average climb among Suunto users in Austria was 457 m. Sehr gut Österreich!
Notable mention to second place Switzerland (418 m) after dropping to eighth place last year. In the previous two years before that it was near the top. Italy (395 m) came third. These results prove once again that alpine nations know the best way to move is upwards!
The overall kick ass nations
Respect to our users in Italy, Spain, Austria, and France, all nations that came in the top five of five or more categories. Italy landed in the top five of 10 different categories, and Spain landed in the top five of seven.
Skimo the go
No surprises here; once again ski mountaineering accumulated the most vertical meters (838 m) on average out of all our activity types. Mountaineering (545 m) and trail running (466 m) came in second and third, as they did last year.
Race to the top
In the race for most total ascents per country, France beat out Spain to win the country that climbed the most. Last year, Spain came out on top. And, once again, Italy came in third.
Impressive individual efforts
There were 1772 participants who climbed more than a thousand meters during the week, and 1095 individual sessions that included more than 1000 meters of climbing. That’s some solid training, folks. Well done!
Top nations by sport
Ski touring
No nation cracked the 1000 m mark this year in the skimo stakes, but it’s clear many users are gunning for this. Keep pushing and nail it next time!
1. Spain 972m 2. Austria 948m 3. Italy 946m 4. Switzerland 921m 5. Slovakia 903m
Mountaineering
Kudos to Sweden, a small nation of 10 million, for coming out on top in the mountaineering category, and for breaking the 1000 m mark. Surprising given last year it didn’t even make the top five.
1. Sweden 1316m 2. Italy 1060m 3. Austria 666m 4. Spain 581m 5. Slovenia 494m
Trail running
People in Asia are crazy about trail running, and once again Asian nations won the podium this year and four were in the top five. Nice!
1. Japan 932m 2. Hong Kong 896m 3. Thailand 676m 4. Greece 649m 5. Malaysia 636m
Mountain biking
Austria won this one, followed by Spain and Italy; all nations in the top five last year, too.
1. Austria 582m 2. Spain 513m 3. Italy 469m4. Switzerland 375m 5. France 356m
Trekking
Notice anything? This time Italy wins and Spain and Austria follow.
1. Italy 559m 2. Spain 397m 3. Austria 375m 4. France 352m 5. Malaysia 316m
Hiking
Malaysia came out on top here, and, as a side note, also came in fifth place for both trekking and trail running. We can imagine exploring the incredible mountainous rainforests in Malaysia must be pretty motivating!
1. Malaysia 606m2. Italy 475m 3. New Zealand 453m4. Slovenia 352m5. Japan 343m
Nordic skiing
Go Canada! Last year Canada came second, behind France. This year they reversed positions.
1. Canada 438m2. France 268m3. Norway 233m4. Austria 218,0m5. Italy 217,6
Cycling
Portugal won after not even making the top five last year. Spain, Italy, Israel and South Africa once again filled the rest of the positions.
1. Portugal 460m 2. Spain 390m 3. Italy 345m 4. New Zealand 316m 5. South Africa 310m
Running
This category had very narrow margins between nations, and a slight reduction in average meters from last year. Last year New Zealand won it. Congrats Norway!
1. Norway 156m 2. Switzerland 151m 3. Czech Republic 142m 4. Italy 140m 5. France 139m
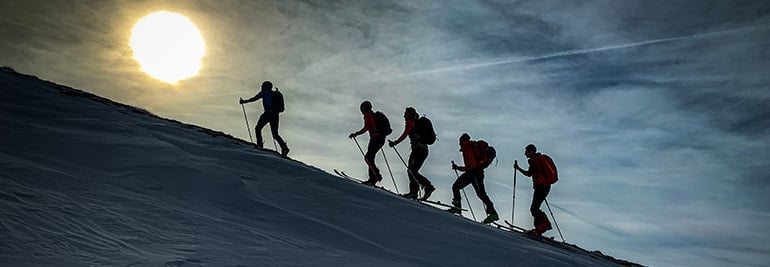
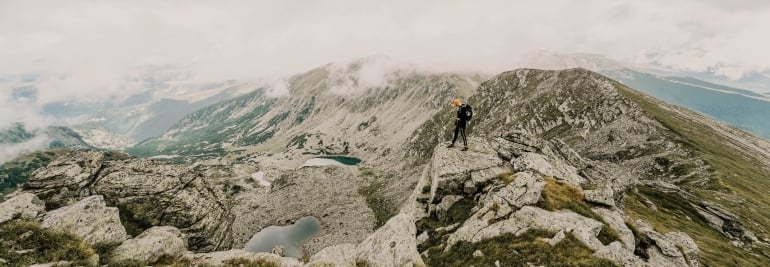
Lead images:
Photo by Klemen Tušar on Unsplash
Photo by Jamie Davies on Unsplash
Read more articles
On the rise: top stories from World Vertical Week 2020
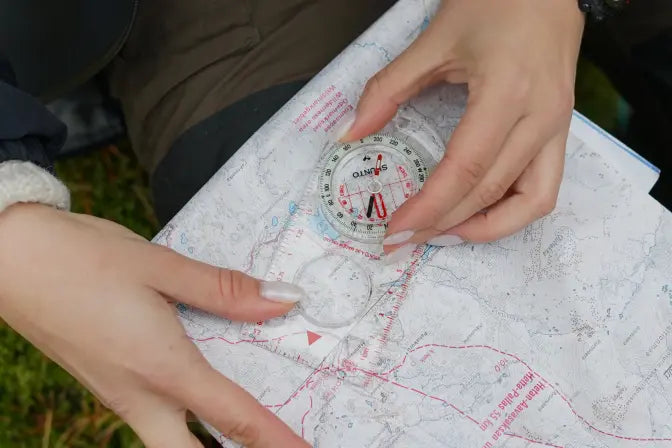
How to find your way in the mountains
7 tips to accelerating your vertical speed


On the rise: top stories from World Vertical Week 2020
© Philipp Reiter
World Vertical Week has become an annual tradition, and many Suunto users are finding creative ways to get the most out of it.
The week is really an invitation to get outside, to push oneself, and find new resolve and strength. It’s also a chance to show that nearby hill or mountain who’s boss.
This year, we again ran a World Vertical Week photo competition with three lucky people winning a Suunto 7 or a Suunto 9. We asked our Instagram followers to share an image with a Suunto app data overlay from one of their ascents over the week and tag #verticalweek. We received so many inspiring entries. Thanks to everyone who participated. Check out the winners and their shots below. Congrats!
Firemen to the rescue!
Two firemen in Finland went above and beyond the call of duty for World Vertical Week. Henri-Aleksi Pietilainen, 29, and his room mate at the Rescue Academy showed their dedication by donning their protective fire gear and ascended the most popular training hill in Helsinki multiple times – and just after finishing a 24 hour shift. Respect guys!
“We thought it was going to be easier (considering my level of training in the mountains and my friend’s latest expedition through Greenland), but the extra 25 kg of weight and unforgettable clothing and gear gave a nice extra ‘touch’ and was really good training,” Henri says. “We did this in a pair because in real firefighting rescue missions it’s good to have a partner to help each other out.”
Cooking up a storm
It was Lukasz Bodaszewski’s first time participating in World Vertical Week. The 39-year old chef from Poland runs a catering company with his wife in the French Alps. He aimed to ascend 3000 m over the week, and managed 2300
“But I finished 1000 m in one day and I’m proud of that,” he says. “Vertical Week was good timing because I’m training for the 160 km Val d’Aran UTMB in the Pyrenees and for 145 km TDS at UTMB this year, so it was good to have a specific climbing week.”
Getting out there
Casey Sackett didn’t hold back for World Vertical Week. From Hurricane, Utah, Casey aimed to achieve a mile of vertical gain (1610 m) over the week. He notched up a total of 1631 over a series of awesome trips, including mountain biking the Gooseberry Mesa and the rest what he refers to as “desert alpinism” (alpine style lines in a desert ecosystem).
“Conditions were perfect all week out here and gave me the opportunity to get out every chance I had!” Casey says. “My favorite push was my last one, trekking/trail running up a mesa to the La Verkin Overlook. My eight-year-old daughter set the pace on the 4 km ascent with almost 243 m of gain. We did it in just 61 minutes! Her endurance blew me away, so proud!”
Thanks again to everyone who got out there and pushed their comfortzone for World Vertical Week. Keep it up!
Lead images: © Philipp Reiter
Read more articles
The nation that climbed the most in World Vertical Week is ...
7 tips to accelerating your vertical speed
How to find your way in the mountains

This challenge will take you higher!
© Phillipp Reiter
Believe it or not, there’s a hill or mountain somewhere that’s looking down at you laughing. It believes you’re a weakling. Do you have what it takes to shut it up?
That’s what Suunto’s annual World Vertical Week is about for the thousands of fans who participate each year. They find a nearby range, hill, or mountain that’s looking at them disrespectfully, and show that large mass of rock and earth who’s boss. As Sir Edmund Hillary famously suggested, there’s something satisfying about knocking the bastard off.
Seriously though, World Vertical Week is about the joy of a challenge, of sweating like a beast, and overcoming one’s resistance to fighting gravity to reach a summit. It’s an inexplicable human urge. All we know is we feel incredible after. To make it even more fun, we give you three incentives below to participate!
To participate in Suunto World Vertical Week 2020, open Suunto app and click the Vertical Week link in your inbox (the bell symbol on the top of your screen takes you to your inbox).
© Phillipp Reiter
New decade, new challenge
Starting on Sunday, February 23 and ending Sunday, March 1, this fifth edition of Suunto World Vertical Week also marks the first of a new decade. That’s why we want it to be the best ever.
For this reason we are sending out two special, optional challenges: climb 1000 m of vertical in one day during the week. Or, if that’s not possible, climb 1000 m over the whole week. That’s only a puny 150 m a day! Just imagine that arrogant hill sniggering if you fail!
Be in to win a Suunto watch
To give you extra incentive, we are running a photo contest on Instagram over the week, and will give away a Suunto 7 smartwatch or a Suunto 9 to three of the most inspiring photos that enter. All you need to do is share an image with a Suunto app data overlay and tag #verticalweek. We will decide the winners at the end of the week!
Click here to learn how to share your activities with Suunto app.
(Terms and conditions apply. Check them here.)
Rep your nation and sport
You can join the challenge on Suunto app, log all your efforts, and also compete for your nation and activity type. Last year, Italy came out on top for average ascents during the week. Spain also kicked ass; it came first in three divisions, and was also in the top five for four different activities. Will they continue to dominate?
To kickstart your competitive spirit, click here to see the results of last year’s Suunto World Vertical Week!
Lead images: © Phillipp Reiter
Read more articles!
Raising the stakes for Suunto World Vertical Week
7 tips to plan a route in the mountains
Which nation runs the fastest? 10 fun facts from 2019
10 ways to make your adventures more sustainable
How to find your way in the mountains.

7 tips to plan a route in the mountains
The better prepared you are the more likely the trip is a success. © Arc'teryx / Piotr Drozdz
While deep in the mountains you are on your own. Take a wrong turn and you might be waiting awhile for the cavalry to arrive. That’s why respect is so important, and one shows that respect for mountain terrain by preparing well.
In the first article in this series on how to navigate in the mountains, we looked at map reading and location awareness. In this second post, our resident navigator-in-chief Terho Lahtinen takes us through the steps of planning a route.
Start somewhere familiar
For the purposes of practice, consider starting somewhere you are familiar with. That way you won’t be afraid of getting lost and will have more confidence to navigate by map and compass. “Another attribute of a good training terrain is it offers enough features to study on the map and in the terrain,” Terho says.
Choose your destination
This seems obvious, right? But it’s important to be clear about this and not have a vague idea. “Choose an area, a specific destination, some other target to visit,” Terho says. “Then consider how much time you have available and what kind of distance you can cover within that time.”
Be realistic
Don’t bite off more than you can chew. Consider the fitness and skill level of your group, and make sure you factor that into your planning. It’s always good to be a little on the cautious side.
Explain your trip plans to the group so you are all on the same page. © Dean Leslie / Red Bull Content Pool
Study the map
Ok, you’ve chosen a destination and considered your group, now it’s time to channel your inner nerd by studying the topographical map of where you intend to go. Notice we said “topographical map”; no tourist maps allowed – they don’t offer enough detail. Here’s what to look at on your trusty topo map:
Terrain features: First get an overview. In mountain areas, it’s essential to recognize the ridges, valleys, passes, rivers and other big formations.
Trail difficulty: If you intend to follow trails, find out what level of difficulty they are. Trails are often rated as easy, medium and difficult, and marked with different dashes on the map depending on the rating.
Trip options: What are the options on the map? For example, is there an easier versus more difficult route? Is there more than one way in and out? Is there a route that offers more shelter? Is there an easier plan B if plan A turns out to be too challenging for the group?
Distance: Measure the distances between points. You can do this by knowing the scale of your map. Every 1 cm on a map in 1:25 000 scale represents 250 m of terrain. Every 1 cm on a map in 1:50 000 scale represents 500 m of terrain. The average walking pace on flat terrain is 4 km/h, and can halve in difficult or steep country. What distance is possible for your group? Remember, the slowest in the group sets the pace!
Ascent/descent: As we mentioned in the previous article, look at the contour lines on the map. Where do they stack together, indicating steepness, and where are they spaced further apart, indicating more level terrain?
Calculate the total ascent and descent sums to estimate how hard or easy certain routes would be. It’s advisable to calculate 300m/h for ascents and 500m/h for descents. Consider the time available and the fitness of your group, and choose a route that ensures you avoid pushing people too far beyond their comfort zone.
Technical difficulty: Look for areas that might prove challenging, such as exposed trails above the treeline, snow cover in shadowed places, ground covered in rocks or tree roots, steep ascents or descents, river crossings, dense forest, or narrow trail. To help understand, research the area online. Try to find trip reports people have written about the area.
Shelter: In the event the weather turns nasty where on your route can you find shelter? This might be natural or manmade shelter.
Water: For overnight or multi day trips, look for water sources on your map.
Accommodation: If it’s on overnight or multi day trip, look for where you will sleep. If you’re camping, find where you are allowed to pitch your tent. If you want to sleep in a mountain hut make sure there are enough beds available and book early.
Be generous with time
On longer day trips or overnight trips, remember to factor in breaks in your planning. “Breaks are not only for resting, they are for enjoying and observing nature, for relaxing and immersion,” Terho says. “They are an essential part of the experience.”
So make sure you are generous in affording break time. Terho recommends to plan a five to 10 minute break each hour, or 10 to 20% of your moving time.
Allow for delays
Take into account the potential for unplanned delays along the way. A sudden lightning storm, torrential rain, a snow-covered trail, a dangerously swollen river, or a flooded trail – there are many things that could slow you down.
“The bigger the group, the more delays there will be as people adjust their gear, change clothing, or have pee breaks,” Terho says. “Factor this in.”
Practice makes perfect
Time for your homework! Using a local topo map, plan a route at home by following the above, and then go out and test the plan in the terrain. When planning, pay attention to the details and terrain features on the map that you should look out for on the trip in order to know you’re staying on the right course. Make a game of trying to identify as many of these features as you can when following the route.
Keep track of time, the degree of difficulty, delays you encountered, and once you are back at home compare how the trip unfolded in comparison to how you envisioned it based on your planning. What was different? What took more time than expected? What was easier?
Stay tuned for the next article in the series: Staying on course in the mountains!
Lead images:
Photo by Toa Heftiba on Unsplash
© Dean Leslie / Red Bull Content Pool
Read more articles:
How to find your way in the mountains
7 tips to find a safe track up the mountain
8 avalanche safety checks to tick off before the ski season

Which nation runs the fastest? 10 fun facts from 2019
Suunto app saves millions of workouts every year, creating a veritable treasure trove of training data. When our data team crunches that mountain of numbers – while respecting personal privacy laws, of course – they discover some surprising sport insights.
Our data nerds have just finished calculating the 2019 workout stats generated by users in nations across the world. Continuing the age old tradition of friendly international sport rivalry, we looked at which nation is the fastest, which nations runs for the longest distance, as well as other stats. We’re sure you’ll find the results as interesting as we do.
Flat and fast: Denmark sets the pace
According to our analysis of all the workouts in 2019, runners in Denmark are lightning. The average pace of our Suunto-wearing Danes is 5:11 min/km! Whoop! That’s quick.
Perhaps it’s not surprising given a 2017 Eurostat survey found Denmark, a nation of 5.6 million, exercises more than all other EU nations, apart from Suunto’s own Finland. Apparently exercise, whether cycling the small nation’s famous bicycle path network or running along its gorgeous coastline, is a core element of Denmark’s culture. Respect!
Click here for tips on how to improve your running economy!
The long run: Portugal goes the distance
Portugal, a nation of 10.3 million, likes to run! Our data shows people in Portugal ran the longest average running distance – 10.3 km/run. It’s the only nation to break the 10 km average distance mark. Bem feito!
Click here for tips on running the distance!
Sleep tight: who sleeps the most/least?
Analyzing all the sleep data proved an interesting exercise. People in Chile, Finland, New Zealand and Ireland enjoy a good night’s sleep; on average they get more than seven hours a night.
Conversely, people living in Asia, including Indonesia, Malaysia, Thailand and South Korea, seem to like burning the candle at both ends; on average they get less than 5.5 hours a night. We hope they’re getting enough recovery time!
Click to read how sleep can make you a better runner!
Feeling great: the most common feeling vibe
It seems like Suunto users are positive bunch – must be all that outdoor exercise. We checked what is the most common feeling recorded after all the workouts, and we discovered “excellent” came out on top. That’s a really good sign. Feelings are a great way to keep track of how your training is going, and to monitor whether you might need to rest more.
Magnifique: the French LOVE trail running
When comparing their trail running to treadmill workouts, the ratio in France is 12.9:1, almost 13 times more trail than treadmill. In the US, by comparison, the ratio was 1.6:1, and in Spain 4.8:1. We’d love to know what causes this big difference!
Around the clock: trail runners move for the longest
Respect to all the trail runners out there. It’s the most popular activity for 12+ hour long activities. That’s a solid length of time to be on your feet moving. We hope you are fueling and hydrating well.
Read to learn how to transition from road to trail running!
By foot wins: running and walking the most popular
Running came out as the most popular activity among Suunto users, followed by walking, and cycling in third place.
Sport lovers: Suunto fans enjoy four activities
On average Suunto users did 4.3 different activities during the year. But some were much more varied; one user tracked 74 different activity types, another one did 72! That’s an impressive performance! We wonder how they found the time!
Go guys! Men walk more
Out analysis shows male Suunto users walk a little more than women. Men walk on average 9446 steps a day, and women 7969. Ladies, show them next year!
Lead images: © Graeme Murray / Red Bull Content Pool
Read more articles:
7 tips for running in the dark
Hunter or the hunted? 7 race tactics for the trophy
Fuelling the engine: 6 principles of nutrition for athletes