


Suunto Blog

Suunto ZoneSense FAQ
Find answers to frequently asked questions about the world’s first real intensity measurement.
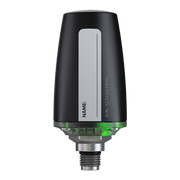
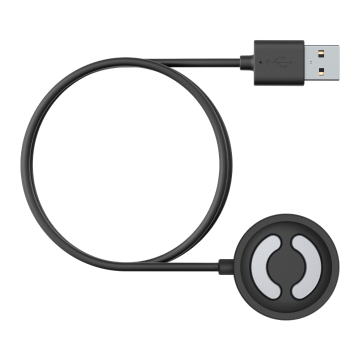
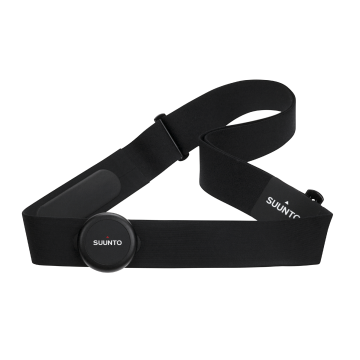
Why does ZoneSense require a heart rate belt?
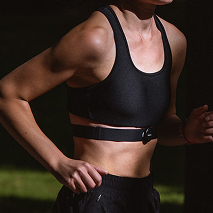
To get accurate measurement of one’s heartbeat requires a heart rate belt. This data is essential for detecting differences between R-R peaks in heart rate. Optical heart rate monitors can only perform this type of measurement reliably at rest, such as during sleep.
Can ZoneSense be used with any heart rate belt?
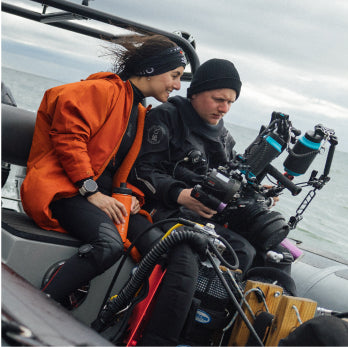
Yes, any heart rate belt that provides beat-to-beat data can be used with ZoneSense. However only Suunto hr belt works in swimming with its inbuild memory.
Can ZoneSense be used with an arm heart rate monitor?
Arm heart rate monitors use optical heartrate. This cannot be used to measure the beat to beat data accurately during exercise, therefore ZoneSense is not available for these sensors.
How can I get ZoneSense on my watch?
To install ZoneSense, go to the Suunto App SuuntoPlus Store, select the ZoneSense Sports app, and save it to your watch. Next time you start your workout, select ZoneSense. For subsequent sessions in the same sport mode, ZoneSense is automatically selected.
Which watches support ZoneSense?
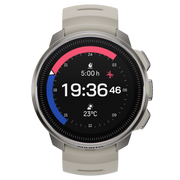
ZoneSense works with all Suunto watches with heart rate belts for post-analysis. This includes older models like Suunto Ambit and Spartan. Live data with ZoneSense is supported on the latest Suunto watches with the latest software, including Suunto 9 Peak Pro, Suunto Vertical, Suunto Race, Suunto Race S, and Suunto Ocean (later in autumn).
What does ZoneSense show on the Suunto app?
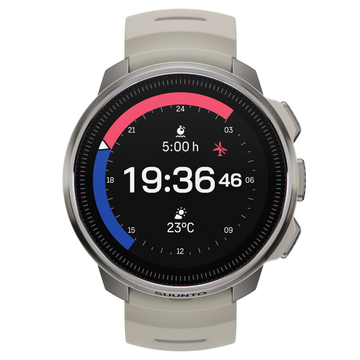
ZoneSense SuuntoPlus sports app shows your intensity graphically as green, yellow and red. Time in currently spend in given intensity and cumulative time in each intensity in workout. The cumulative time doesn’t include the first 10 minutes of training, as this period cannot be measured (read about this on next question).
The athlete can press the upper right button on their watch to change the fields shown, to follow other values such as pace, vertical, speed, power instead of cumulative time in zones.
Is it normal that ZoneSense SuuntoPlus sports app doesn’t show the intensity of my training’s first 10 minutes?
Yes. The ZoneSense DDFA (Dynamical Detrended Fluctuation Analysis) index cannot be measured accurately during the first 10 minutes as the body is typically then still warming up. The real-time measurement and after analysis therefore don’t show the data during this time.
Is it normal that cannot see my friend's ZoneSense numbers?
The ZoneSense analysis is visible only for your own workouts, and is hence personal.
Can I see ZoneSense data in my old workouts?
Yes you can. However, these numbers should be treated with caution, and most accurate data is received from new workouts with ZoneSense enabled.
My old workouts with ZoneSense data looks a bit off, what is the reason?
As ZoneSense is published in mid September 2024, each new workout is used to understand your personal sport specific baseline level of the DDFA. This will make the ZoneSense analysis more accurate over time. The older workouts prior enabling ZoneSense will have ZoneSense data, but as these do not include personal baseline analysis, the ZoneSense has error that can shift the ZoneSense graph 10-20% higher/lower.
Is there a way to make ZoneSense measurement more accurate?
As ZoneSense measures each workout, it will analyze the athlete’s normal aerobic baseline heart-rate variability with the DDFA index, used in as a parameter of the ZoneSense measurement. The intensity state of aerobic (green), an-aerobic (yellow) and vo2max (red) ranges are then evaluated based on the shift from this normal aerobic level, a.k.a. the workout baseline. The workouts that have very little aerobic effort will not contribute to this baseline definition. To have the best possible accuracy with ZoneSense, please ensure that you have easy aerobic sessions in your training regularly to analyze the effort of different types of training.
How can I get the best possible aerobic & an-aerobic threshold as heartrate evaluated?
You can use ZoneSense as an intensity measurement without the need to analyze the intensity with pace, power or heartrate. But there are workouts such as short intervals where pace and power are more suitable as they react to intensity changes immediately. Naturally, the athlete can use heartrate as a measure of intensity, as well as power and pace. There is an analysis feature with ZoneSense where Suunto App defines the aerobic and an-aerobic threshold as heartrate with the DDFA. This analysis maps the heartrate to the ZoneSense DDFA index shifts cross aerobic and an-aerobic thresholds. To get a result from this analysis, the athlete needs to do a workout where intensity is tough and challenging. The intensity needs to grow from aerobic area to an-aerobic level, to get the aerobic threshold as a heartrate result. Similarly, to get the an-aerobic threshold, the athlete needs to do a workout that will have intensity in vo2max range.
To get a threshold result, the athlete can do a workout where he/she increases the intensity of the effort step by step. Increasing the intensity gradually ensures that there is enough measurement data in each effort level and therefore as the athlete goes over thethresholds it’s possible to identify heartrate at this intensity. This can be done in different sports such as running, cycling, rowing, even swimming. The idea of step-by-step protocol is to stay in each intensity for several minutes for example jogging easily for 3mins, then increasing each 3 minutes the pace and repeat this until max effort.
Sports and use cases
Why should I start workouts at an easier effort with ZoneSense?
ZoneSense establishes a personal intensity scale by measuring “DDFA index” during easy aerobic efforts. This baseline is updated with each workout but cannot be identified in high-intensity efforts. Accurate measurements therefore require regular easy workouts to keep the personal DDFA level up to date.
This personal baseline level can change throughout the year and can have differences even on day to day basis. Therefore, the best possible accuracy in the measurement you can get with ZoneSense requires a warmup period at the start of the workout.
My workout did not seem to be in “right intensity”, what could be the reason?
ZoneSense is best when used while doing workouts with steady effort, or during long intervals. The short bursts of effort, for example 1 minute intervals, do not reach homeostasis in your body. Therefore the DDFA index used with ZoneSense does not represent the intensity at that time.
Each workout you do will impact how your personal ZoneSense measurement works. The normal easy aerobic level measured with DDFA is saved to your watch & personal profile. As you do a new workout it will contribute to this baseline measurement. If you do a first run with Suunto and this would be with very high effort, the ZoneSense can try to measure this DDFA level as your normal state. This might provide the wrong type of output. Ensure you make easy efforts also with your Suunto watch and heartrate belt, so that your normal baseline is calibrated accordingly.
When should I use ZoneSense instead of pace, power, or heartrate to identify my training intensity zones?
ZoneSense is ideal for steady workouts, such as long aerobic, hard threshold sessions or long interval sessions that last over 3 minutes. For short intervals, like 1-minute sprints, use running pace or cycling power for more accurate measurement. ZoneSense requires the athlete to work on given intensity at least 2-3 minutes in order to properly show the intensity level.
However, with ZoneSense you will learn which effort level in power, pace, vertical speed, swim pace you can sustain in your aerobical, an-aerobical and vo2 max area. This information you can be useful in daily training when adjusting your effort in each workout.
How does ZoneSense work with team or racquet sports?
In sports where the athlete can be working out constantly, ZoneSense can indicate whether the activity is primarily aerobic or anaerobic. However, due to delays in the measurement of ZoneSense and the nature of short bursts in the most common team and racquet sports, the actual effort intensity might not be shown correctly with ZoneSense. For example a 1-minute max out sprint followed up by longer rest lag can be shown in ZoneSense as completely aerobic level intensity training.
However, if the higher efforts are repeated with short recovery periods, the cumulative impact will be shown in ZoneSense.
ZoneSense is evolving, and feedback from sports scientists, coaches, and athletes is welcome to improve its application.
How can ZoneSense be used for swimming?
The Suunto heart rate belt stores data within its sensor module, as the heartrate signal cannot be transmitted underwater. Once on land or at the edge of a pool, the beat-to-beat heart rate data is transferred to the watch. ZoneSense data is then available for post- analysis to learn the real intensity from the session. Does ZoneSense work with strength training?
ZoneSense focuses on aerobic and an-aerobic efforts by analyzing DDFA – the Dynamical Detrended Fluctuation Analysis index. Strength training intensity is based on muscular effort, not cardiovascular, making ZoneSense less suitable for strength-based workouts.
Can ZoneSense consider muscular fatigue, heat or other stress factors?
ZoneSense measures the stress of the heart which correlates with the aerobic, an-aerobic, vo2max states, but there are examples that indicate that ZoneSense can consider other factors that impact performance. For example, the fatigue in a muscle seems to impact the athlete so that ZoneSense will reach higher intensity levels faster. This means that the performance level shows decline when having muscle fatigue and in order to keep working out in normal level they would need to ease the effort.
Could ZoneSense be used to measure intensity in challenging levels of altitude or in hot conditions?
In altitude or in hot conditions, heart rate, pace and power measurements do not represent the intensity defined in laboratory conditions. Challenging and abnormal conditions make it difficult for the athlete to understand what a suitable effort level would be. There is a possibility that ZoneSense can be used in different conditions, as it measures the stress level of the heart and therefore is considering different internal and external stressors. However, this aspect will require more research.
ZoneSense analysis
Why isn’t the start of the exercise shown in the analysis?
The initial part of the workout serves as a warmup, allowing the body to adjust to exercise mode. During this time, measuring heart rate variability does not accurately correlate with exercise intensity. As a result, ZoneSense does not display data during this period in live tracking or in post-analysis.
Why isn’t short intense effort shown as hard effort with ZoneSense?
ZoneSense measures stress with DDFA, which has inherent delays. When you start a sprint, it takes several seconds to minutes for your body and heart rate to adjust. In a normal ramp-up test protocol in laboratory conditions, this delay is managed by working in the same effort for more than three minutes. During this time, the body metabolism “matches” the effort intensity such as lactate level in blood. Similarly, ZoneSense requires a set of data before producing a relevant DDFA value, resulting in a delay of up to 1-2 minutes.
When gauging the right intensity level in running, cycling, swimming with shorter intervals or sprinting, the best measurements of intensity would be speed, pace, and power measurements. However, these will require predefined zone levels. ZoneSense can be used in after analysis to understand the power and speed levels in given effort, illustrated with the ZoneSense DDFA index.
Science background
What is the difference between HRV, RMSSD, DFA-1and DDFA?
These are different metrics used to analyze heart rate variability (HRV):
HRV: Heartrate variability means the variation in time intervals between heartbeats. When the heartrate is 60 beats per minute, the average time between beats is 1 second. When a person is relaxed the variability between beat to beat has a difference, for example time between beats is 950ms (about 1 second),1050 ms, 940ms and so on.
RMSSD: The Root Mean Square of Successive Differences is the most common method to calculate the short-term heart rate variability. This is commonly used to measure stress levels during the night or daytime stress test. This is used in Suunto to analyze your recovery state with night time measurements.
DFA -1: DFA-1 refers to the short-scale scaling exponent covering 4-16 beat-to-beat intervals. The scaling exponent is conventionally computed for the full time series, thus giving one number as an output.“DDFA, on the other hand, covers all the time scales from 4 beat-to-beat intervals to even thousands, and gives an output for each particular time scale (4, 5, 6, ..., 1000). Furthermore, those values are given dynamically as a function of time. As a result, DDFA gives as an output a two-dimensional map of scaling exponents. Thus, DDFA is significantly more accurate and reliable than DFA-1, and as a real-time method it is responsive to changes in physiological conditions.
**DDFA**: Dynamical Detrended Fluctuation Analysis. The method evaluates how the heartbeat intervals change with respect to each other, and how these changes at some time affect the changes of heartbeat intervals during other times. Such dependencies between the intervals are called correlations. DDFA evaluates the characteristics of these correlations very precisely at every instant of time. How do aerobic and anaerobic thresholds work with ZoneSense?
ZoneSense measures the DDFA index during and after training. The anaerobic threshold is identified as a -0.5 change from the "0 baseline," and the aerobic threshold is set at -0.2. These levels correlate with laboratory tests but are indicative values representing changes in your metabolic system. Consistent use of ZoneSense provides a simple method for tracking intensity without frequent lab tests. ZoneSense illustrates the metabolic state of the body by measuring the stress level of the heart.
In principle, your daily fatigue, hydration level, heat, muscle soreness, running terrain and many other aspects can impact your current state of your body, impacting this DDFA index. For instance, you can reach your aerobic threshold at a slower pace than some days before.
How does ZoneSense measure heart rate thresholds?
ZoneSense maps changes as aerobic and an-aerobic thresholds to corresponding heart rate values. Sudden changes in intensity can introduce errors, so it is best to consider several workouts before setting heart rate zones in your Suunto watch.
Learn more
Where can I learn more?
Visit Suunto ZoneSense Page for detailed information on ZoneSense, including news, articles, webinars, and scientific insights.
Interested in testing ZoneSense together with Suunto?
If you are a national team, sports scientist, or pro-club interested in ZoneSense, please reach out to Suunto here

Introducing ZoneSense: Revolutionizing Intensity insights with Heart Stress Measurement
ZoneSense offers insights into whether your body's physiology is working aerobically with lower stress levels or if it has transitioned into higher stress, anaerobic efforts.
Different sports impose varying demands on your cardiovascular system. Measuring intensity with heart rate can be difficult as the heart rate changes across different activities such as cycling and cross-country skiing, where same heart rate can be aerobic in one sport and an-aerobic in another. Additionally, daily performance fluctuations up to 5-10% can make it challenging to use predefined intensity levels.
ZoneSense addresses these challenges by measuring the heart's response to workout intensity in real-time. This innovative technology empowers athletes to monitor their exertion levels daily across various sports disciplines. The following examples show how the ZoneSense measures your heart in different activities.
Aerobic sessions
Aerobic long run
To keep the long runs purely aerobic, athlete should keep the ZoneSense state green most of the time. Its normal to see constant fluctuation of the DDFA index value in easy efforts such as in this example mainly around +0 - +0.4. On outdoor runs where athlete might need go over some hills, the Zonesense can illustrate this by turning to an-aerobic time to time. This type of few spikes that goes bit over aerobic threshold, is normal aerobic workouts.
Long ride with 3x45min an-aerobic effort
The example illustrates a long bike ride of 5.5 hours, where the last part of the ride includes three 45minute sections with “Ironman race pace effort”. The three 45min work sections illustrate the effort at and above aerobic threshold as DDFA index turn mostly to yellow. As the temperature is close to 30 degrees, one can observe a raised heartrate after 3.5 hours, where the workout intensity is kept the same, but heart rate has now elevated by 15-20 beats per minute. ZoneSense however shows the steady intensity level.
Interval sessions
Long intervals - Cycling
The harder interval sessions where athlete is working at an-aerobic threshold or even above can be hard to quantify on everyday sessions, do I go too hard or is it too easy. The ZoneSense helps to illustrate if you were reaching the threshold or did you go even beyond. The example here illustrates 6 x 7 min intervals above an-aerobic threshold. The ZoneSense gradually increases during the first 2-3 minutes in interval to get above threshold level.
Interval workouts are a common way to do the harder training efforts. ZoneSense DDFA index requires a longer period of consistent intensity due to time it takes the body to reach the homeostasis. The ZoneSense requires the effort to be consistent at least 2-3 minutes to accurately represent the intensity level, with shortchanges this is not achieved. In the above example if the interval would have been stopped after 2 minutes, even with high effort the ZoneSense would have not reached the an-aerobic state. This can also be seen from the heart rate in the background, during the first 2 minutes the heart rate is rising despite constant effort. This is caused by the heart’s slow adaptation to the changed intensity level.
Long intervals - Open Water Swimming
ZoneSense is not limited only to most common endurance sports such as running and cycling. Here is an example of an open water swim session where an athlete has done a 12 x 300m repetitions in lake with a short 30-45s rest between. The goal of the session has been to swim in good sustainable tempo pace. The ZoneSense illustrates this by reaching the an-aerobic level at end of each repetition. The pace is kept the same except with the last one being harder. The cumulative load of the work is illustrated by the last half of the repetitions always reaching an-aerobic state where the first ones don’t all reach this.
Long intervals - Rowing
Following is a rowing workout 4x6min hard efforts and 8x 40s with 20s recovery. ZoneSense shows effort reaching to over an-aerobic threshold. The shorts repetitions also reach red, as recovery is short.
Short intervals with short recovery - Cycling
With high volume of short intervals done with short recovery, the ZoneSense is able to illustrate the cumulative intensity. The example here illustrates the large volume of intervals with short recovery, 13x30s with 15second recovery. This effort can be shown as a black line illustrating cycling power. The ZoneSense DDFA index grows during the first five repetitions into an-aerobic range and then with next few following reps will reach the vo2max range represented in red color. This illustrates nicely the load for higher volume reps where the effort in power can be argued to be on correct level. Here the 15 seconds recovery is so short that the body’s homeostasis doesn’t recover into low intensity between the repetitions and rather describes the cumulative intensity of the constant intervals.
Short intervals with long recovery - Running
The ZoneSense is not able to monitor short bursts with longer recovery sessions in a meaningful manner. ZoneSense requires to reach a homeostasis with the intensity. The running interval example with 20x400m with 40 s recovery illustrates that the measurement does not indicate the harder running pace as interval duration is short with relatively long recovery. If the intervals would have been longer each interval would have reached an-aerobic intensity or if recovery would have been shorter the cumulative intensity impact would have been shown as in the previous example.
Higher Intensity Near Anaerobic Threshold
Half marathon
The following examples illustrate the ZoneSense in session where intensity is an-aerobic and reaches regularly an-aerobic threshold level. This example is from a half marathon race where recreational runner is pushing their own limits close to 1.5hours. The racecourse has some turns and hills, which impact on the intensity effort that athlete is working. The ZoneSense shows the intensity at an-aerobic effort in yellow with several sections shown at red in vo2 range. When comparing the black line illustrating the pace, one can observe a slight gradual decline of the pace. Similarly, one can see slight decline in heartrate. However the ZoneSense illustrate the yellow & red sections as athlete has tried to keep the intensity as high as possible.
Ice hockey with various effort spikes.
Its common method for endurance sports athletes to do a performance test in laboratory to establish the aerobic and an-aerobic levels as heart rate, pace or power. But for many sports this is not possible as the laboratory protocols do not represent sport in real life. Here is an example of an ice hockey game where players have been using ZoneSense to measure their effort during the game. Each work effort is shown as an-aerobic work where spikes in VO2max area.
For team sports such as ice hockey, football, basketball its very difficult to understand the real intensity levels as laboratory test done in treadmill or exercise bike doesn’t truly correlate to the effort in the field. ZoneSense could be a solution for some of these sports or training sessions for these athletes.
The challenge with ZoneSense is the requirement for constant work. Effort that leads to homeostasis a.k.a. balance needs to be long enough to DDFA index truly represent the intensity of the work. With many team sports and racquet sports, this can be a limitation with very short work durations and long rest periods. However, even if the games themselves couldn’t be measured with ZoneSense the training sessions with enough cumulative work could potentially be applicable for ZoneSense. This would be the long waited intensity measurement in team sports.
Muscle fatigue impact
ZoneSense is measuring stress with heart rate variability. This stress effect correlates to metabolic state of the body, where less stress is aerobic, and more is an-aerobic. However, the metabolic state is not the only effect but can be induced with other stress factors. Here is a test example where an athlete has done two ramp up protocols with ergometer in one workout. The first part can be seen from 8min-16min and the second at 1h 15min – 1h 23min. The middle part of the session was strength training heavy leg exercises. The impact of fatigue in leg muscles can be witnessed on the ramp up protocol where ZoneSense reaches a higher intensity range compared to the first version. The impact is not massive, but still illustrates the other stressful factors.
By measuring the actual response of the heart to workout intensity, ZoneSense offers athletes a reliable and daily tool to optimize their training across different sports. This technology is set to revolutionize how athletes understand and manage their physical stress levels, enhancing performance and recovery.
A similar impact of muscle load and potential different intensity levels can be found in the hiking session. The steep uphill and downhill make the workout become an-aerobic. Where the heartrate itself especially in downhill wouldn’t indicate this. The muscle fatigue and stress associated raises the ZoneSense intensity.


Run Your Own Virtual UTMB with Suunto
The 171-km race around the Mont Blanc massif is the most prestigious trail ultra in the world. With the new SuuntoPlus sports app, you can test the challenge wherever you are!
The Ultra-Trail du Mont-Blanc (UTMB) is one of the most prestigious and challenging trail running races globally. Its origins are rooted in the desire to create a race that encapsulates the grandeur and difficulty of running through the mountainous terrain surrounding Mont Blanc.
The first race was held in 2003. This year, runners will line up for the start at Place du Triangle de l'Amitié in the heart of Chamonix on August 30.
It can be hard to grasp how long the race actually is. To give you a feeling of the challenge, we have created the Virtual UTMB SuuntoPlus sports app that tracks your cumulative progress towards completing the legendary route.
Whether you are looking for a fun way to motivate yourself or aiming to one day run the race yourself, this sports app is for you!
The Virtual UTMB sports app shows your progress towards running the distance of the 171 km Ultra Trail du Mont Blanc: the top row shows your total distance and progress towards the goal, below you see your current activity distance and duration.
Here’s how it works:
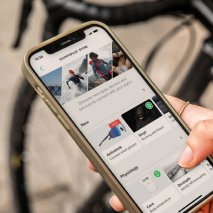
Go to the SuuntoPlus Store in the Suunto app and sync the Virtual UTMB sports app on your watch.
Before starting your next run, go to ‘exercise settings’ and select the Virtual UTMB sports app in the SuuntoPlus section.
Start your activity. The Virtual UTMB sports app will be added as an extra screen. You will be notified as your reach the distance to various aid stations on the course.
The next time you use the same sport mode, the Virtual UTMB sports app will be there by default and keep adding distance towards your cumulative total of 171 km – the distance of the Ultra-Trail du Mont-Blanc.
Suunto is the official technical partner of the UTMB World Series. Learn about the races at utmb.world.
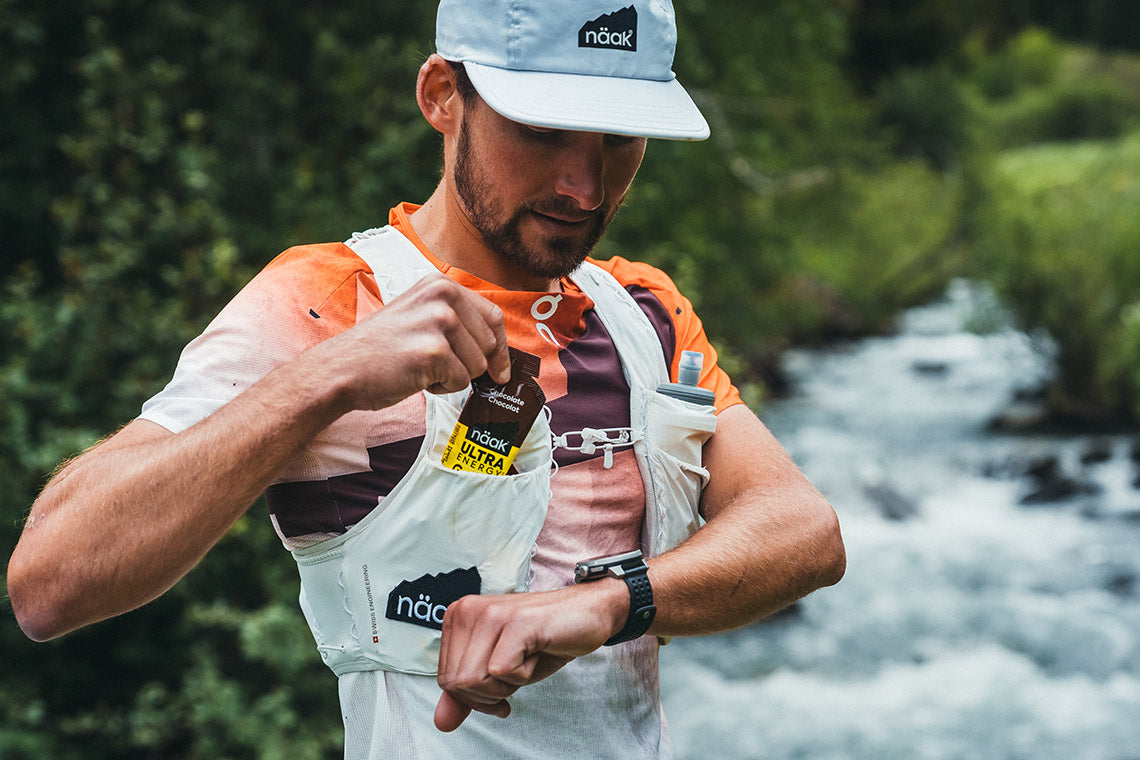

Sync Your Tailored Näak Nutrition Plans to Your Suunto Watch
We have partnered with the nutrition experts at Näak to provide you with real-time nutrition guidance.
Gastric and dietary issues affect 85% of runners and are the leading cause of abandonment, says Näak. The company has made reducing these figures their greatest challenge.
First, they created the Nutrition Calculator: a simple, concrete, and user-friendly online tool that designs personalized nutrition plans for you, based on your profile, goals, and race characteristics.
Now, Näak partners with Suunto to sync your custom nutrition & hydration plan to your Suunto watch for real-time guidance. A plan is a plan, but you also need to execute it well. That's when the SuuntoPlus Näak Nutrition Guide comes into play!
How to Use
1. Go to the Näak website and plan your nutrition needs for your race. Select the race you are interested in. Fill in the required info, like your personal profile and a target time.
2. Click ‘Add to Suunto’ on the result page to connect your Näak and Suunto accounts. The plan is then pushed to your Suunto account.
3. Before starting an activity, go to ‘Exercise settings’ -> ‘SuuntoPlus’ and scroll down to select ‘Näak Nutrition Guide’ for your race.
4. During the activity, you will see the nutrition guidance on its own screen on your Suunto watch.
All images by Simon Morice. Athlete Arthur Joyeux Bouillon.

23 must-read articles that guide you into Suunto’s world of training
Train
Put in the hard work, understand your training load and the different stimuli you are putting on your body.
Figure out your training zones
Key components to improve your fitness are frequency, duration and intensity. Frequency and duration are easy to understand, but training intensity is a bit more tricky. How hard is hard? And why should I care? Read on to learn about intensity zones and about defining them. Read more
Manage your training with Suunto app’s Training zone
A progressive training load with adequate recovery and ways to follow progress will lead to a successful adventure or race. The new training toolset in Suunto app’s Training zone is vast. Read on and learn what’s available. We are sure you will find your new favorite dataset to analyze your training and follow your progress. Read more
Understand and manage your training load with Suunto
Suunto app’s long-term analysis view tracks your training load and helps you stay in balance – whether that means progress, maintaining your fitness or avoiding over-training. Here are four scenarios to help you understand the graphs. Read more
Training with TSS and hrTSS
What are TSS and hrTSS and how can these training metrics help? Read more
View TSS and other power-based cycling metrics in real-time
Normalized Power, Intensity Factor and Training Stress Score are key metrics for all cyclists who use power meters in their training. You can view these metrics in real-time on Suunto Vertical, Suunto Race, Suunto 9 and Suunto 5 watches. Read more
Know your power source: the body’s three energy systems
Understanding how your energy is produced can aid training and improve your quality of life. Suunto partner PerfectPace explains your main power sources. Read more
Unlock your interval training and watch your running improve
Follow Golden Trail World Series champion, Trail Running World Champion and running coach Stian Angermund’s advice and do interval training right to get results. Read more
3 interval sessions for trail runners
Trail running world champion Stian Angermund explains three interval training drills to help you increase your speed and power. Read more
Plan your interval workouts with Suunto app
Build a workout in Suunto app and let your watch guide you through your session! Read more
8 Essential running form drills
Improve your running technique with these essential running form drills – and follow them as a SuuntoPlus Guide on your watch! Read more
Intro to distance running technique
In this article we dig deep into the details of running technique with six key areas for you to focus on. Read on to learn more! Read more
Improve your running with high-intensity hill repeats
Hill repeats build your strength and improve your speed and coordination. This article presented by TrainingPeaks coach Steven Brandes highlights the importance of high-intensity hill repeats and how to do them successfully. Read more
Boost your hill training with SuuntoPlus Climb
Hill repeats are an essential part of an outdoor athlete’s workout repertoire. To make the hard work pay off, pacing is key. The new Climb SuuntoPlus™ feature does just that: it gives you real-time insights into your effort and motivates you to keep going. Read more
Using the Track to Learn How to Properly Pace Your Run
Using the track is a great way to improve your ability to pace yourself correctly. In this article presented by TrainingPeaks coach Todd Parker introduces a workout that helps you get in touch with the right pace for you. Read more
5 reasons why endurance athletes should do high-intensity strength training
Boost your vertical speed and avoid injury by lifting heavy weights.
To improve vertical speed and endurance, high-intensity resistance training should be an essential component of your training plan, says sports scientist, coach and athlete Susi Kraft. Read more
12 high-intensity strength training exercises for endurance athletes
Follow our training video and SuuntoPlus Guide to get stronger. In this article, sports scientist, coach and ski mountaineer Susi Kraft explains and demonstrates how to perform 12 strength-building exercises correctly and safely. Read more
Is the ultimate cross-training… breathing?
Sports coaches worldwide talk about 'good fundamentals’ – you’ve got to own the basics before you can even begin to achieve mastery in a discipline. But former pro freediver Mike Maric takes that deeper than most, by addressing one of the most basic functions of life: breathing. The medically educated forensic scientist from Italy has taken what he’s learned from free diving and applied it to a multitude of other sports – with stunning success. Read more
Control your core body temperature and get better performance results
Your core body temperature can massively impact your performance. That’s why athletes pour water over themselves during races. They’re trying to cool down because they know once their core body temperature reaches a certain level, they’ll lose power and their performance will deteriorate. Like heart rate and power, core body temperature is a crucial metric for elite and recreational athletes alike. Read more
Recover
There’s no one without the other: put in the hard work and rest to rise to the next level.
Four ways to follow your recovery with Suunto
Am I able to recover from my workouts? Is my mental recovery at the same level as physical? Do I ensure recovery with a good amount of sleep? Read on to learn how Suunto can help you in your recovery! Read more
How to use HRV to optimize your recovery
Heart rate variability (HRV) is a helpful metric for endurance athletes. Read on to learn why there’s a buzz around it and how to use Suunto to track heart rate variability. Read more
Learn how sleep can make you a better runner
Sleeping well should come naturally, right? Yet many of us feel tired most of the week. A sleep doctor gives six tips to help you improve your running and overall quality of life. Read more
4 tips to recover well for your best performance
One often ignored component to keep your training steady is ensuring you are getting enough recovery time. It can seem like taking a break from running will disrupt your momentum, but oftentimes it does the exact opposite – it freshens you up and reinvigorates you. Read more
Progress
Is your fitness having an upward trend? Understanding your progress is both motivating and helps you understand if your training has a positive impact.
How to follow your progress with Suunto
The essence of training is to improve physical performance. But how do you know if you are progressing? In this article, you will learn how Suunto can help you. Read more
Test your fitness with Suunto
Here are five SuuntoPlus sports apps that will help you find the right intensity zones for your training and track your progress. Read more


Suunto Vertical keeps evolving
Follow the latest updates and developments of your Suunto Vertical GPS watch and enjoy it to its full potential.
On this page you can see in a timeline view how your Suunto Vertical has evolved since it was launched in June 2023.
To always have the latest watch software, we recommend you enable automatic, over the air software updates in the watch settings. Also, make sure you are using the latest version of Suunto app for iOS or for Android.
You can find dozens of SuuntoPlus sports apps in Suunto mobile app’s SuuntoPlus Store and the ever-growing list of Suunto compatible partner services is here.
March 2024
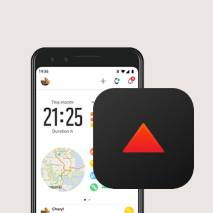
The new Vertical Week sports app was published to SuuntoPlus Store. The SuuntoPlus Vertical Week sports app can be used to track the total elevation gain of multiple workouts during the week. Learn more about Suunto World Vertical Week 2024.
Pace your mountain races with SuuntoPlus Vertical Race sports app. The Vertical Race sports app is designed to be used on vertical races. Set you race distance, vertical meters and goal time and follow the pace data live on your Suunto.
Follow and improve your running technique with Stryd SuuntoPlus sports app. The Stryd sensor provides data such as ground contact time, vertical oscillation, leg stiffness and impact loading rate. Read more about improving your running technique with Suunto and Stryd here
For ultrarunners, there is now an Ultrarun& walk SuuntoPlus sports app that will track how much one runs, walks, or stays still on the race. The app helps you to pace & analyse long efforts. This sports app has been built by trailrunner Alessio Sclocco who is also part of Suunto fieldtest community.
A software update for Suunto Vertical, Suunto Race and Suunto 9 Peak Pro was released. The update delivered three new watch faces, better support for emojis in mobile notifications and a pause reminder.
The update also provided navigation enhancements with improved high contrast map style for use with always on display and a new ruler tool to measure distances on map to nearby locations.
Suunto app was updated with performance improvements to data sync between watch and Suunto app and a user interface change to how workout summary values are shown in the app.
New Suunto connected partner services include Base de Vitesse aimed for surfers and sailors, Be Number one sport for competing in your sports, MoveEffect aimed for corporate health and Mia Health to engage in your fitness journey.
You can find the latest list of partners from here
February 2024
New Winter maps map layer with downhill and cross-country skiing tracks came available in Suunto app to help you find the best places to ski.
Waypoint import was improved for GPX route import with better waypoint compatibility with route planning services.
Training Zone Summary now shows swim pace, average power and normalised power.
Performance improvements to data sync between watch and Suunto app
Suuntoplus Power Zones and Pace Zones sports apps were published for runners and riders. Now you can follow the cumulative time in each zone and see which zone you currently are working out.
Suunto is now compatible Xioami MiFitness. Xiaomi users can now connect their devices with Suunto via Mifitness app. This gives the possibility to use Suunto app tools as well as get connected with Suunto ecosystem. Read more here.
January 2024
Race with the new SuuntoPlus Race Pacer sports app. Set your target distance and time with even or negative splits.
Now you can follow your Runna training plans in your Suunto watch
FIT-UP app is now suunto compatible, designed for fitness, nutrition and mindfulness
Suunto app calendar view now includes date numbers, offering a clearer overview of your training schedule.
New interactivity in Suunto app route planning: touch the altitude profile chart to see corresponding locations on the map.
Sleep analysis in Suunto app has been upgraded to support multiple naps within a single day, giving you a more comprehensive understanding of your rest patterns.
Switching between the data table and graph in Suunto app’s Training Zone Summary is now more intuitive and user-friendly.
Suunto app now remembers your last used settings for feed filtering (All/Me/Following) and your preferred Training Zone tab and graph types, making your experience more personalized and efficient.
In the Training Zone Summary, selecting categories like All running sports, All cycling sports, and All swimming sports is now simpler. You can choose these categories without having to select each sport individually.
We've fixed formatting issues in SuuntoPlus data, ensuring more accurate and readable information.
We have also made several other bug fixes and performance improvements to ensure a smoother and more reliable experience.
December 2023
Better Training analysis
Suunto app’s Lap Table now features color-coded columns. Variations from the median lap values are highlighted in shades of red and blue. This color-coding makes it easier to spot laps where your performance was significantly higher or lower than median.
We’ve introduced zone graphs for Pace and Power in the workout analysis. These graphs are complemented by a distribution view of pace and power zones, providing a more intuitive understanding of your workout intensities.
With Training Zone Summary you can now visualize your selected data through a graph. Summary also includes filters for both automatically and manually tagged workouts. For added convenience in filtering, options such as “All running” or “All cycling” are available, enabling you to select all activities under these categories effortlessly.
Plan your adventures with Suunto App
Suunto App Route planning has received new features: the ability to reverse planned routes and the addition of “Back to Start” and “Backtrack” options, enhancing your planning capabilities.
User experience enhanced.
New defaults Sport apps preinstalled to sport modes. When you, as an example, start your tennis workout, it already has tennis sport app, and weight training has Gym Timer.
Suunto App has now streamlined the recovery features by combining the Recovery and Sleep tabs into a single, unified Recovery tab, simplifying access to your recovery and sleep data
Celebrate the end of the year with your achievements with Annual report in Suunto app and share the updated yearly summary also in story format (9:16).
Get more out of your sports with new partners
RaceID miles partner app gets Suunto compatible
Runology running technique video analysis gets Suunto compatible
Runredeem is now Suunto compatible with their loyalty program customers
Surlo app for sailing and other water sports gets Suunto connected
Get more out of your Indoor cycling training with Suunto compatible ICTtrainer
Ride with BMC companion app which is now Suunto compatible
November 2023
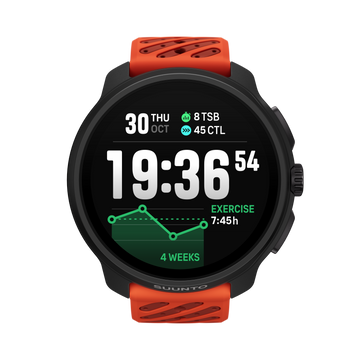
Training, recovery and progress come to your watch, including Heart Rate Variability (HRV)
Follow training load and volume with training widgets in your watch.
Follow recovery status from training with TSB and feeling in your watch.
Measure Heart rate variability (HRV) to optimize your recovery.
Follow your progress with chronic training load (CTL) widget.
Get Suunto Coach comments in training widgets.
Exercise with new rope skipping activity type.
Read more:
How to use HRV to optimize your recoveryHow to follow your progress with Suunto Training with TSS Follow Training load Must-read articles that guide you into Suunto’s world of training
The watch now fits better to your daily life
New UI structure with mini widgets
Customization of the widgets using Suunto app: Select the widgets you want to have on your watch and change the order they are shown.
Improved the watch user interface speed
A higher zoom level on the maps
‘Find my phone’ feature on your watch
Do not disturb mode
New media controls
Multiple alarms
New connections
KML file import in Suunto app
Suunto Vitality compatibility now includes AIA Malaysia
October 2023
Better Training analysis
Follow the training impacts of workouts in Suunto app
SuuntoPlus Vertical race segment guide available in SuuntoPlus Store for Malaysian Suunto fans.
Enhanced user experience
The Suunto App home screen can now be filtered with all, me or following.
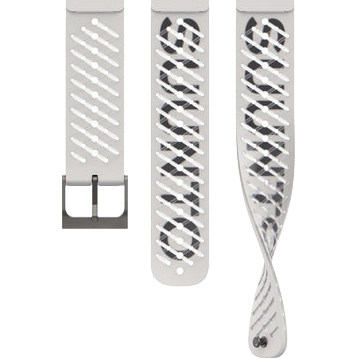
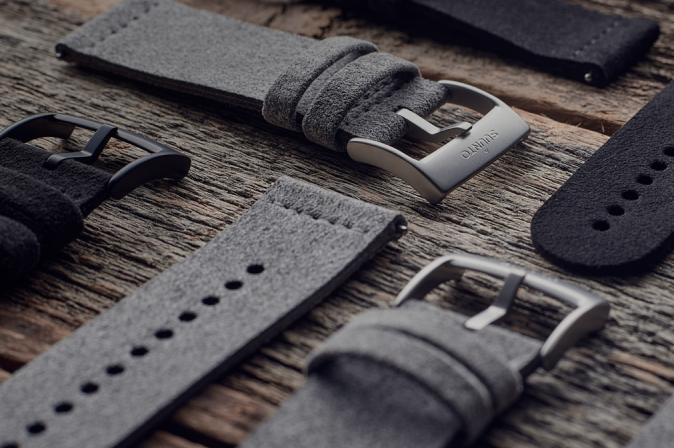
New, colourful Suunto accessory straps
September 2023
New tools to understand you training impact and intensity
Training summary: A tool to analyse & find your key workouts in Suunto app. Go to Training Zone tab and check the Summary.
Movement: Track your movements with wrist acceleration to follow the overall workout intensity. Gets you the insights of rapid efforts.
Heart rate zones: Follow the cumulative time spent on different heart rate zones on one screen. Great to keep the intensity on target.
Fused zones: Shows which intensity zone you are currently in, looking at different intensity metrics and based on that evaluating the best matching as a result.
Peak Pace: Track the peak pace efforts on your run.
Peak power: Track the hard sprints and efforts on your wrist.
Plan better
Interval planner: Use the Interval planner in Suunto app now with all activity types.
Prepare for optimal race
Race nutrition: Plan your race nutrition and get reminders right on your Suunto.
Race companion: A simple, customizable tool that shows you the key information during a race.
Backyard ultra: Race companion for Backyard Ultra racers. Follow each 6.7km loop and keep track of the laps – and when to go next!
Get most out of your sport
Gym Timer: Follow the recovery time between the sets. Adjust as needed and then go again.
Score – Golf: Count each strike and measure the distance of the drives with the Golf Score sport app.
Score – Tennis: Keep count of the game score on your wrist.
Score – Soccer: Keep up with the game score and get alerted with the half time.
Score – Badminton: Keep up with the badminton game score.
Score counter: Counter for any game. Play with 1–4 players and keep the results on your wrist.
Learn more: Discover dozens of SuuntoPlus sport apps for your Suunto
July 2023
New sensor compatibility
Train.red: Connect your Suunto with a Train.red sensor to follow your muscle oxygen levels. The data will also be available in after analysis.
June 2023
Strava updates
In addition to syncing your activities to Strava and using Strava routes with your Suunto watch, you can now also race Strava Live Segments with your Suunto. Learn how to chase Strava segments with your Suunto
Get more out of your sports
Surfer: Count each wave surfed automatically. Each wave is also stored as laps in your surf session.
Running economy: Follow the running economy with heartrate vs. pace. Running economy is illustrated with a beats/km value.
Shoe Tester: Follow test protocol to test different shoes to see which are the fastest for you.
Disc Golf: Keep track of each disc golf throw and see the distance thrown.
Get ready for the outdoors
Weather forecast sports app: Keep the forecasted weather on our wrist while doing the long ride or hike.
ICE: Store your emergency information on your wrist. If you don’t move the watch, it will start an alert to draw attention to the info.
Relief Maps: Gets Suunto connected with 3d maps and live data sharing for outdoor enthusiast.
Join challenges with Uprace App
Race in Virtual Races Tackitup app
Suunto Weekend Adventure collections published in Komoot