


Suunto Blog


Join Suunto Commuting Day 2024 and fight CO₂e emissions together
Brave the weather (or simply enjoy it if the conditions are good) and join us for Suunto Commuting Day on October 24, 2024!
Small, everyday choices are the beginning of change. One single commute may not seem like much, but over time, it all adds up. And when we look at the entire Suunto community, we can see that together we can make a bigger impact!
On Commuting Day, track your human-powered commute with your Suunto device and tag it as a commute. After the event, we'll calculate how much CO2e we saved together!
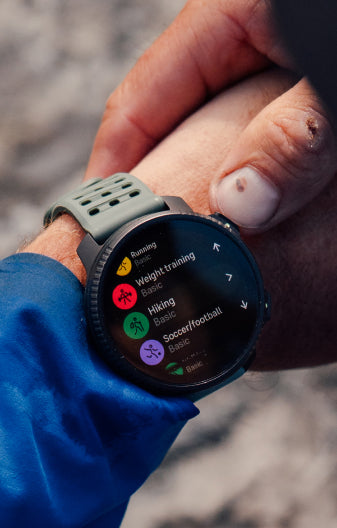
Tracking CO2e savings with the Suunto app is simple: ride, run, or walk from point A to point B and save your activity. The Suunto app can automatically tag one-way trips that start and end at least 500 meters (0.3 miles) apart as commutes. If you don’t have auto-tagging on, you can enable it in the Suunto app settings ('Settings' > 'Tags'). To manually tag your commutes, go to the activity, select 'Edit', 'Add tags', and choose 'Commute'.
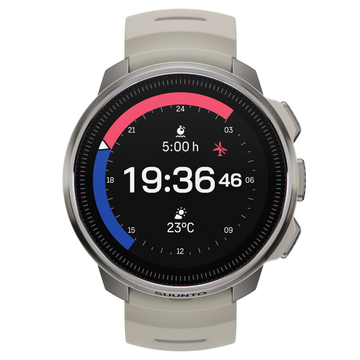
The reduced CO2e emissions for a single activity will be shown in the workout summary. Your monthly total for CO2e savings can be viewed in the commuting widget on the app’s home page.
You don’t even need a Suunto watch or a Suunto-compatible Hammerhead bike computer to start tracking your human-powered commutes – you can also use the Suunto app for free. Download the Suunto app for iOS here or for Android here.
Learn more about tracking human-powered commutes and your CO2e savings
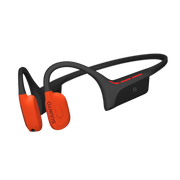
Share your Commuting Day activity with Suunto app for a chance to win Suunto Wing open-ear headphones!
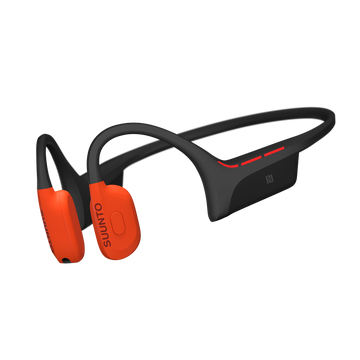
Share your Suunto Commuting Day activity on Instagram via the Suunto app and tag @suunto for a chance to win Suunto Wing open-ear headphones! Open-ear headphones are ideal for urban commutes, allowing you to listen to audio while still hearing your surroundings.
To share your commute, add a photo to your activity in the Suunto app and include the CO2e savings data for your commute. Three of the most inspiring posts shared between October 24 and October 27 will win Suunto Wing open-ear headphones. (Terms and conditions apply. Learn more here.)
Learn more about sharing with Suunto app
Calculating saved CO2e emissions
CO2e demonstrates the global warming potential (GWP) of all six greenhouse gases in one number. We calculate your emission reduction by comparing cycling, walking or running to driving your car.
About the calculation
CO2e (Carbon Dioxide Equivalent) emissions of travel by car (average of a petrol/diesel powered car). Emission factor: 0.166867 kg CO2e/km. CO2e demonstrates the global warming potential (GWP) of all six greenhouse gases: CO2, CH4, N2O, HFCs, PFCs, SF6, NF3 in one number. Data source: Govt of UK, Dept. of Business, Energy & Industrial Strategy, 2023.
Committed to be better
Learn more about our sustainability efforts here. We know we are not perfect, but we are committed to be better.


Learn from your run with Hannes Namberger
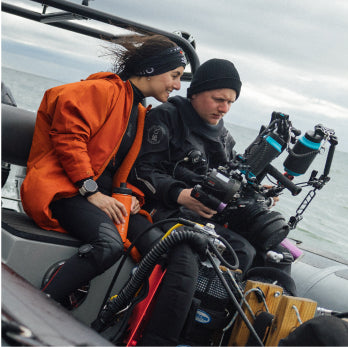
After winning the Lavaredo Ultra Trail (for the third time!), ultra runner Hannes Namberger shares some of his activity data from the race – and his tips how you can learn from your races, too!
Hannes Namberger has once again demonstrated why he's one of the world's top ultrarunners, clinching his third victory at the Lavaredo Ultra Trail by the UTMB back in June. Throughout the challenging 120 km course, Hannes relied on his deep understanding of race strategy and some valuable data that helped him be prepared for the race and ultimately stay ahead of the competition.
For a closer look at how Hannes leverages his data and insights, and to get a detailed breakdown of his race day performance, watch the full video below. And, as a bonus, you might learn a thing or two that will benefit you as well!
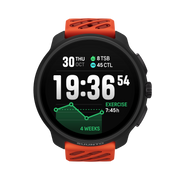
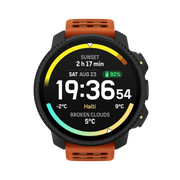
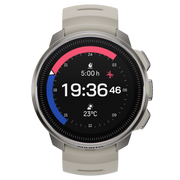
Learn more about Hannes's watch of choice, the Suunto Race here


Revealing Secrets of the Heart with DDFA by MoniCardi
A Technological Breakthrough from Tampere University
MoniCardi, a medical technology and software company originating from Tampere University, has been diligently developing novel and heart rate variability (HRV) methods to decode the intricate phenomena of the human body. The MoniCardi team aims to unveil the various physiological characteristics influenced by the heart's behavior, opening new frontiers in health and performance measurement.
The Foundation: Validation with Massive Datasets
MoniCardi's groundbreaking research is rooted in statistical and time-series analysis methods originally developed in computational physics. These methods have surprising, yet highly impactful applications in electrocardiography, including HRV analysis.
MoniCardi's novel methods and their usefulness have been validated in various scientific studies [1-9] and they have been featured in the leading conferences of cardiology such as the Scientific Sessions of American Heart Association. The studies include exploitation of massive datasets such as the extensive Finnish Cardiovascular Study (FINCAVAS), which contains comprehensive measurement data from 4386 participants of a clinical stress test. In a recent breakthrough study [1], it was found that MoniCardi's HRV analysis of a one-minute rest phase prior to the test predicts sudden cardiac death significantly better than the conventional analysis of the complete 20-minute stress test (hazard ratios of ~2.5 and ~1.5, respectively). The superiority of MoniCardi increases further when considering all the other risk factors in the analysis.
Outside clinical studies, MoniCardi's patented methodology allows accurate estimation of metabolic thresholds in sport applications. This was confirmed in a ground-breaking study published by the team in the leading physiological journal in 2023 [2]. The study was featured in several national and international news sites, including a full-page article in the main Finnish newspaper Helsingin Sanomat (link below). The results are currently under validation in academic collaboration between Tampere University and the Finnish Institute of High-Performance Sport (KIHU). Through a partnership with Suunto launched in 2024, MoniCardi's novel technology is now entering in the use of professional athletes, sport enthusiasts and all the consumers interested in these novel features that push the HRV analysis into a completely new level and ensure practical and actionable results.
Understanding Heart Rate Variability (HRV)
Heart rate variability (HRV) measures the variation in the time intervals between consecutive heartbeats. By analyzing the fluctuations in these intervals, it is possible to gain insights into the body's state, particularly the autonomic nervous system's influence on the heart. Conventionally, HRV has been used to gauge recovery states during sleep through RMSSD (Root Mean Square of Successive Differences), which observes nightly changes in HRV to detect stress levels. At rest, the body shows significant variability between heartbeats, known as HRV. However, as the body encounters increased stress, the autonomic nervous system shifts into the fight-or-flight mode, resulting in minimal heart rate variability. This reduction in HRV can be used as an indicator to assess stress levels.
Introducing DDFA: A Revolutionary Measurement Technology
HRV methods are conventionally split into time-domain, frequency-domain and nonlinear methods. One of the most common nonlinear methods is Detrended Fluctuation Analysis (DFA) developed in the early 1990s. The key information provided by DFA is the overall long-term characteristics of HRV in terms of correlations, in particular, how changes in heartbeat intervals at some time affect the changes at another time. This information has powerful predictive value, but the practical usefulness of this information was unleashed only recently, when Dynamical DFA (DDFA) was developed [8,9] and further refined to assess changes in HRV correlations in a time-sensitive manner [10]. In brief, DDFA utilizes a multitude of "measure sticks" from 4 up to >50 consecutive heartbeats. At every instant of time, DDFA then gives a so-called scaling exponent - a characteristic feature of correlations in heartbeat intervals - for all these measure sticks simultaneously. This information can be precisely mapped to the physiological state during physical exercise.
Real-Time Intensity Monitoring
DDFA excels in assessing real-time changes in the heartbeat correlations during exercise. Training intensity directly correlates with time- and scale-dependent variations in the DDFA scaling exponent. Research indicates that increasing intensity in physical exercise decreases the scaling exponents. Eventually, at very high intensities, the beat-to-beat intervals may show so-called anticorrelations, where large and small beat-to-beat intervals alternate in a specific manner depending on the time scale. This information allows for precise monitoring of exercise intensity and physiological thresholds.
Visualizing DDFA in Action
A pivotal study, "Estimation of Physiological Exercise Thresholds Based on Dynamical Correlation Properties of Heart Rate Variability," published in Frontiers in Physiology in 2023 [2] illustrates DDFA's capabilities. The research paper presents an exercise scenario where intensity increases over time. The cyan lines denote the two metabolic thresholds: LT1 (aerobic threshold) and LT2 (anaerobic threshold), with the black dotted set on locations where these thresholds would be based blood lactate levels.
This illustrates an ideal scenario where the DDFA-based analysis yields threshold levels nearly identical to those obtained using lactate-based threshold definitions. While this represents the optimal case, variations are expected in real applications. The DDFA analysis and lactate-based thresholds may differ from case to case, with heart rate measurements typically matching within +-5 beats per minute. There are also uncertainties inherent in lactate thresholds, which are subject to interpretation.
Validity up to clinical accuracy
MoniCardi methodology has been used to predict the overall cardiac risk and sudden cardiac death [1], and several cardiac diseases such as long QT syndrome [4,5], atrial fibrillation and congestive heart failure [in preparation]. The methods have also been applied to estimate stress and sleep stages [6,7]. The prediction of sudden cardiac death [1] has gained traction and it was featured in all the big news sites in Finland (YLE, Helsingin Sanomat, Ilta-Sanomat, Aamulehti) and on several international news sites (list below).
In medical technology, MoniCardi is currently collaborating with Cardiolex Medical, a Swedish MedTech company developing modern ECG devices and systems. MoniCardi is also seeking partners in wearable technologies to bring cardiac risk assessment to mass markets.
References:
[1] Jussi Hernesniemi, Teemu Pukkila, Matti Molkkari, Kjell Nikus, Leo-Pekka Lyytikäinen, Terho Lehtimäki, Jari Viik, Mika Kähönen, Esa Räsänen, Prediction of sudden cardiac death with ultra-short-term heart rate fluctuations, JACC: Clinical Electrophysiology, 2024
[2] Matias Kanniainen, Teemu Pukkila, Joonas Kuisma, Matti Molkkari, Kimmo Lajunen, and Esa Räsänen, Estimation of Physiological Exercise Thresholds Based on Dynamical Correlation Properties of Heart Rate Variability, Front. Physiol. 14 (2023).
[3] Teemu Pukkila, Matti Molkkari, Matias Kanniainen, Jussi Hernesniemi, Kjell Nikus, Leo- Pekka Lyytikäinen, Terho Lehtimäki, Jari Viik, Mika Kähönen, and Esa Räsänen, Effects of Beta Blocker Therapy on RR Interval Correlations During Exercise, Computing in Cardiology 50 (2023) 10.22489/CinC.2023.104
[4] Matias Kanniainen, Teemu Pukkila, Matti Molkkari, and Esa Räsänen, Effect of Diurnal Rhythm on RR Interval Correlations of Long QT Syndrome, Computing in Cardiology 50 (2023) 10.22489/CinC.2023.287 [5] T. Pukkila, M. Molkkari, J. Kim, and E. Räsänen, Reduced RR Interval Correlations of Long QT Syndrome Patients, Computing in Cardiology 49 (2022) 10.22489/CinC.2022.284
[6] Teemu Pukkila, Matti Molkkari and Esa Räsänen, Dynamical Heartbeat Correlations During Complex Tasks – A Case Study in Automobile Driving, Computing in Cardiology 48 (2021) 10.23919/CinC53138.2021.9662676
[7] M. Molkkari, M. Tenhunen, A. Tarniceriu, A. Vehkaoja, S.-L. Himanen, and E. Räsänen,
Non-Linear Heart Rate Variability Measures in Sleep Stage Analysis with Photoplethysmography, Computing in Cardiology 46 (2019); 10.22489/cinc.2019.287
[8] M. Molkkari, G. Angelotti, T. Emig, and E. Räsänen, Dynamical Heartbeat Correlations During Running, Sci. Rep. 10, 13627 (2020)
[9] M. Molkkari and E. Räsänen, Robust Estimation of the Scaling Exponent in Detrended Fluctuation Analysis of Beat Rate Variability, Computing in Cardiology 45 (2018); 10.22489/CinC.2018.219
[10] M. Molkkari and E. Räsänen, Inter-beat interval of heart for estimating condition of subject, Patent pending.
Latest news of MoniCardi
International news:Science Daily: https://www.sciencedaily.com/releases/2024/06/240613140808.htmScience Alert: https://www.sciencealert.com/new-algorithm-can-predict-and-help- prevent-sudden-cardiac-deathMirage News: https://www.miragenews.com/tampere-university-researchers- predict-sudden-1255528/Medical XPress News: https://medicalxpress.com/news/2024-01-method-based-series-analysis-thresholds.html
Finnish news:
YLE: https://yle.fi/a/74-20093771Helsingin Sanomat: https://www.hs.fi/tiede/art-2000009847625.htmlIlta-Sanomat: https://www.is.fi/terveys/art-2000010505400.htmlAamulehti: https://www.aamulehti.fi/tiedejateknologia/art-2000010497986.html https://www.aamulehti.fi/tiedejateknologia/art-2000009863997.htmlSTT: https://www.sttinfo.fi/tiedote/70082024/aikasarja-analyysiin-perustuva-uusi-menetelma-helpottaa-urheilun-kynnysarvojen- maarittamista?publisherId=69818730&lang=fi

Suunto ZoneSense FAQ
Find answers to frequently asked questions about the world’s first real intensity measurement.
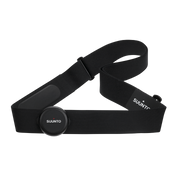
Why does ZoneSense require a heart rate belt?
To get accurate measurement of one’s heartbeat requires a heart rate belt. This data is essential for detecting differences between R-R peaks in heart rate. Optical heart rate monitors can only perform this type of measurement reliably at rest, such as during sleep.
Can ZoneSense be used with any heart rate belt?
Yes, any heart rate belt that provides beat-to-beat data can be used with ZoneSense. However only Suunto hr belt works in swimming with its inbuild memory.
Can ZoneSense be used with an arm heart rate monitor?
Arm heart rate monitors use optical heartrate. This cannot be used to measure the beat to beat data accurately during exercise, therefore ZoneSense is not available for these sensors.
How can I get ZoneSense on my watch?
To install ZoneSense, go to the Suunto App SuuntoPlus Store, select the ZoneSense Sports app, and save it to your watch. Next time you start your workout, select ZoneSense. For subsequent sessions in the same sport mode, ZoneSense is automatically selected.
Which watches support ZoneSense?
ZoneSense works with all Suunto watches with heart rate belts for post-analysis. This includes older models like Suunto Ambit and Spartan. Live data with ZoneSense is supported on the latest Suunto watches with the latest software, including Suunto 9 Peak Pro, Suunto Vertical, Suunto Race, Suunto Race S, and Suunto Ocean (later in autumn).
What does ZoneSense show on the Suunto app?
ZoneSense SuuntoPlus sports app shows your intensity graphically as green, yellow and red. Time in currently spend in given intensity and cumulative time in each intensity in workout. The cumulative time doesn’t include the first 10 minutes of training, as this period cannot be measured (read about this on next question).
The athlete can press the upper right button on their watch to change the fields shown, to follow other values such as pace, vertical, speed, power instead of cumulative time in zones.
Is it normal that ZoneSense SuuntoPlus sports app doesn’t show the intensity of my training’s first 10 minutes?
Yes. The ZoneSense DDFA (Dynamical Detrended Fluctuation Analysis) index cannot be measured accurately during the first 10 minutes as the body is typically then still warming up. The real-time measurement and after analysis therefore don’t show the data during this time.
Is it normal that cannot see my friend's ZoneSense numbers?
The ZoneSense analysis is visible only for your own workouts, and is hence personal.
Can I see ZoneSense data in my old workouts?
Yes you can. However, these numbers should be treated with caution, and most accurate data is received from new workouts with ZoneSense enabled.
My old workouts with ZoneSense data looks a bit off, what is the reason?
As ZoneSense is published in mid September 2024, each new workout is used to understand your personal sport specific baseline level of the DDFA. This will make the ZoneSense analysis more accurate over time. The older workouts prior enabling ZoneSense will have ZoneSense data, but as these do not include personal baseline analysis, the ZoneSense has error that can shift the ZoneSense graph 10-20% higher/lower.
Is there a way to make ZoneSense measurement more accurate?
As ZoneSense measures each workout, it will analyze the athlete’s normal aerobic baseline heart-rate variability with the DDFA index, used in as a parameter of the ZoneSense measurement. The intensity state of aerobic (green), an-aerobic (yellow) and vo2max (red) ranges are then evaluated based on the shift from this normal aerobic level, a.k.a. the workout baseline. The workouts that have very little aerobic effort will not contribute to this baseline definition. To have the best possible accuracy with ZoneSense, please ensure that you have easy aerobic sessions in your training regularly to analyze the effort of different types of training.
How can I get the best possible aerobic & an-aerobic threshold as heartrate evaluated?
You can use ZoneSense as an intensity measurement without the need to analyze the intensity with pace, power or heartrate. But there are workouts such as short intervals where pace and power are more suitable as they react to intensity changes immediately. Naturally, the athlete can use heartrate as a measure of intensity, as well as power and pace. There is an analysis feature with ZoneSense where Suunto App defines the aerobic and an-aerobic threshold as heartrate with the DDFA. This analysis maps the heartrate to the ZoneSense DDFA index shifts cross aerobic and an-aerobic thresholds. To get a result from this analysis, the athlete needs to do a workout where intensity is tough and challenging. The intensity needs to grow from aerobic area to an-aerobic level, to get the aerobic threshold as a heartrate result. Similarly, to get the an-aerobic threshold, the athlete needs to do a workout that will have intensity in vo2max range.
To get a threshold result, the athlete can do a workout where he/she increases the intensity of the effort step by step. Increasing the intensity gradually ensures that there is enough measurement data in each effort level and therefore as the athlete goes over thethresholds it’s possible to identify heartrate at this intensity. This can be done in different sports such as running, cycling, rowing, even swimming. The idea of step-by-step protocol is to stay in each intensity for several minutes for example jogging easily for 3mins, then increasing each 3 minutes the pace and repeat this until max effort.
Sports and use cases
Why should I start workouts at an easier effort with ZoneSense?
ZoneSense establishes a personal intensity scale by measuring “DDFA index” during easy aerobic efforts. This baseline is updated with each workout but cannot be identified in high-intensity efforts. Accurate measurements therefore require regular easy workouts to keep the personal DDFA level up to date.
This personal baseline level can change throughout the year and can have differences even on day to day basis. Therefore, the best possible accuracy in the measurement you can get with ZoneSense requires a warmup period at the start of the workout.
My workout did not seem to be in “right intensity”, what could be the reason?
ZoneSense is best when used while doing workouts with steady effort, or during long intervals. The short bursts of effort, for example 1 minute intervals, do not reach homeostasis in your body. Therefore the DDFA index used with ZoneSense does not represent the intensity at that time.
Each workout you do will impact how your personal ZoneSense measurement works. The normal easy aerobic level measured with DDFA is saved to your watch & personal profile. As you do a new workout it will contribute to this baseline measurement. If you do a first run with Suunto and this would be with very high effort, the ZoneSense can try to measure this DDFA level as your normal state. This might provide the wrong type of output. Ensure you make easy efforts also with your Suunto watch and heartrate belt, so that your normal baseline is calibrated accordingly.
When should I use ZoneSense instead of pace, power, or heartrate to identify my training intensity zones?
ZoneSense is ideal for steady workouts, such as long aerobic, hard threshold sessions or long interval sessions that last over 3 minutes. For short intervals, like 1-minute sprints, use running pace or cycling power for more accurate measurement. ZoneSense requires the athlete to work on given intensity at least 2-3 minutes in order to properly show the intensity level.
However, with ZoneSense you will learn which effort level in power, pace, vertical speed, swim pace you can sustain in your aerobical, an-aerobical and vo2 max area. This information you can be useful in daily training when adjusting your effort in each workout.
How does ZoneSense work with team or racquet sports?
In sports where the athlete can be working out constantly, ZoneSense can indicate whether the activity is primarily aerobic or anaerobic. However, due to delays in the measurement of ZoneSense and the nature of short bursts in the most common team and racquet sports, the actual effort intensity might not be shown correctly with ZoneSense. For example a 1-minute max out sprint followed up by longer rest lag can be shown in ZoneSense as completely aerobic level intensity training.
However, if the higher efforts are repeated with short recovery periods, the cumulative impact will be shown in ZoneSense.
ZoneSense is evolving, and feedback from sports scientists, coaches, and athletes is welcome to improve its application.
How can ZoneSense be used for swimming?
The Suunto heart rate belt stores data within its sensor module, as the heartrate signal cannot be transmitted underwater. Once on land or at the edge of a pool, the beat-to-beat heart rate data is transferred to the watch. ZoneSense data is then available for post- analysis to learn the real intensity from the session. Does ZoneSense work with strength training?
ZoneSense focuses on aerobic and an-aerobic efforts by analyzing DDFA – the Dynamical Detrended Fluctuation Analysis index. Strength training intensity is based on muscular effort, not cardiovascular, making ZoneSense less suitable for strength-based workouts.
Can ZoneSense consider muscular fatigue, heat or other stress factors?
ZoneSense measures the stress of the heart which correlates with the aerobic, an-aerobic, vo2max states, but there are examples that indicate that ZoneSense can consider other factors that impact performance. For example, the fatigue in a muscle seems to impact the athlete so that ZoneSense will reach higher intensity levels faster. This means that the performance level shows decline when having muscle fatigue and in order to keep working out in normal level they would need to ease the effort.
Could ZoneSense be used to measure intensity in challenging levels of altitude or in hot conditions?
In altitude or in hot conditions, heart rate, pace and power measurements do not represent the intensity defined in laboratory conditions. Challenging and abnormal conditions make it difficult for the athlete to understand what a suitable effort level would be. There is a possibility that ZoneSense can be used in different conditions, as it measures the stress level of the heart and therefore is considering different internal and external stressors. However, this aspect will require more research.
ZoneSense analysis
Why isn’t the start of the exercise shown in the analysis?
The initial part of the workout serves as a warmup, allowing the body to adjust to exercise mode. During this time, measuring heart rate variability does not accurately correlate with exercise intensity. As a result, ZoneSense does not display data during this period in live tracking or in post-analysis.
Why isn’t short intense effort shown as hard effort with ZoneSense?
ZoneSense measures stress with DDFA, which has inherent delays. When you start a sprint, it takes several seconds to minutes for your body and heart rate to adjust. In a normal ramp-up test protocol in laboratory conditions, this delay is managed by working in the same effort for more than three minutes. During this time, the body metabolism “matches” the effort intensity such as lactate level in blood. Similarly, ZoneSense requires a set of data before producing a relevant DDFA value, resulting in a delay of up to 1-2 minutes.
When gauging the right intensity level in running, cycling, swimming with shorter intervals or sprinting, the best measurements of intensity would be speed, pace, and power measurements. However, these will require predefined zone levels. ZoneSense can be used in after analysis to understand the power and speed levels in given effort, illustrated with the ZoneSense DDFA index.
Science background
What is the difference between HRV, RMSSD, DFA-1and DDFA?
These are different metrics used to analyze heart rate variability (HRV):
HRV: Heartrate variability means the variation in time intervals between heartbeats. When the heartrate is 60 beats per minute, the average time between beats is 1 second. When a person is relaxed the variability between beat to beat has a difference, for example time between beats is 950ms (about 1 second),1050 ms, 940ms and so on.
RMSSD: The Root Mean Square of Successive Differences is the most common method to calculate the short-term heart rate variability. This is commonly used to measure stress levels during the night or daytime stress test. This is used in Suunto to analyze your recovery state with night time measurements.
DFA -1: DFA-1 refers to the short-scale scaling exponent covering 4-16 beat-to-beat intervals. The scaling exponent is conventionally computed for the full time series, thus giving one number as an output.“DDFA, on the other hand, covers all the time scales from 4 beat-to-beat intervals to even thousands, and gives an output for each particular time scale (4, 5, 6, ..., 1000). Furthermore, those values are given dynamically as a function of time. As a result, DDFA gives as an output a two-dimensional map of scaling exponents. Thus, DDFA is significantly more accurate and reliable than DFA-1, and as a real-time method it is responsive to changes in physiological conditions.
**DDFA**: Dynamical Detrended Fluctuation Analysis. The method evaluates how the heartbeat intervals change with respect to each other, and how these changes at some time affect the changes of heartbeat intervals during other times. Such dependencies between the intervals are called correlations. DDFA evaluates the characteristics of these correlations very precisely at every instant of time. How do aerobic and anaerobic thresholds work with ZoneSense?
ZoneSense measures the DDFA index during and after training. The anaerobic threshold is identified as a -0.5 change from the "0 baseline," and the aerobic threshold is set at -0.2. These levels correlate with laboratory tests but are indicative values representing changes in your metabolic system. Consistent use of ZoneSense provides a simple method for tracking intensity without frequent lab tests. ZoneSense illustrates the metabolic state of the body by measuring the stress level of the heart.
In principle, your daily fatigue, hydration level, heat, muscle soreness, running terrain and many other aspects can impact your current state of your body, impacting this DDFA index. For instance, you can reach your aerobic threshold at a slower pace than some days before.
How does ZoneSense measure heart rate thresholds?
ZoneSense maps changes as aerobic and an-aerobic thresholds to corresponding heart rate values. Sudden changes in intensity can introduce errors, so it is best to consider several workouts before setting heart rate zones in your Suunto watch.
Learn more
Where can I learn more?
Visit Suunto ZoneSense Page for detailed information on ZoneSense, including news, articles, webinars, and scientific insights.
Interested in testing ZoneSense together with Suunto?
If you are a national team, sports scientist, or pro-club interested in ZoneSense, please reach out to Suunto here

Introducing ZoneSense: Revolutionizing Intensity insights with Heart Stress Measurement
ZoneSense offers insights into whether your body's physiology is working aerobically with lower stress levels or if it has transitioned into higher stress, anaerobic efforts.
Different sports impose varying demands on your cardiovascular system. Measuring intensity with heart rate can be difficult as the heart rate changes across different activities such as cycling and cross-country skiing, where same heart rate can be aerobic in one sport and an-aerobic in another. Additionally, daily performance fluctuations up to 5-10% can make it challenging to use predefined intensity levels.
ZoneSense addresses these challenges by measuring the heart's response to workout intensity in real-time. This innovative technology empowers athletes to monitor their exertion levels daily across various sports disciplines. The following examples show how the ZoneSense measures your heart in different activities.
Aerobic sessions
Aerobic long run
To keep the long runs purely aerobic, athlete should keep the ZoneSense state green most of the time. Its normal to see constant fluctuation of the DDFA index value in easy efforts such as in this example mainly around +0 - +0.4. On outdoor runs where athlete might need go over some hills, the Zonesense can illustrate this by turning to an-aerobic time to time. This type of few spikes that goes bit over aerobic threshold, is normal aerobic workouts.
Long ride with 3x45min an-aerobic effort
The example illustrates a long bike ride of 5.5 hours, where the last part of the ride includes three 45minute sections with “Ironman race pace effort”. The three 45min work sections illustrate the effort at and above aerobic threshold as DDFA index turn mostly to yellow. As the temperature is close to 30 degrees, one can observe a raised heartrate after 3.5 hours, where the workout intensity is kept the same, but heart rate has now elevated by 15-20 beats per minute. ZoneSense however shows the steady intensity level.
Interval sessions
Long intervals - Cycling
The harder interval sessions where athlete is working at an-aerobic threshold or even above can be hard to quantify on everyday sessions, do I go too hard or is it too easy. The ZoneSense helps to illustrate if you were reaching the threshold or did you go even beyond. The example here illustrates 6 x 7 min intervals above an-aerobic threshold. The ZoneSense gradually increases during the first 2-3 minutes in interval to get above threshold level.
Interval workouts are a common way to do the harder training efforts. ZoneSense DDFA index requires a longer period of consistent intensity due to time it takes the body to reach the homeostasis. The ZoneSense requires the effort to be consistent at least 2-3 minutes to accurately represent the intensity level, with shortchanges this is not achieved. In the above example if the interval would have been stopped after 2 minutes, even with high effort the ZoneSense would have not reached the an-aerobic state. This can also be seen from the heart rate in the background, during the first 2 minutes the heart rate is rising despite constant effort. This is caused by the heart’s slow adaptation to the changed intensity level.
Long intervals - Open Water Swimming
ZoneSense is not limited only to most common endurance sports such as running and cycling. Here is an example of an open water swim session where an athlete has done a 12 x 300m repetitions in lake with a short 30-45s rest between. The goal of the session has been to swim in good sustainable tempo pace. The ZoneSense illustrates this by reaching the an-aerobic level at end of each repetition. The pace is kept the same except with the last one being harder. The cumulative load of the work is illustrated by the last half of the repetitions always reaching an-aerobic state where the first ones don’t all reach this.
Long intervals - Rowing
Following is a rowing workout 4x6min hard efforts and 8x 40s with 20s recovery. ZoneSense shows effort reaching to over an-aerobic threshold. The shorts repetitions also reach red, as recovery is short.
Short intervals with short recovery - Cycling
With high volume of short intervals done with short recovery, the ZoneSense is able to illustrate the cumulative intensity. The example here illustrates the large volume of intervals with short recovery, 13x30s with 15second recovery. This effort can be shown as a black line illustrating cycling power. The ZoneSense DDFA index grows during the first five repetitions into an-aerobic range and then with next few following reps will reach the vo2max range represented in red color. This illustrates nicely the load for higher volume reps where the effort in power can be argued to be on correct level. Here the 15 seconds recovery is so short that the body’s homeostasis doesn’t recover into low intensity between the repetitions and rather describes the cumulative intensity of the constant intervals.
Short intervals with long recovery - Running
The ZoneSense is not able to monitor short bursts with longer recovery sessions in a meaningful manner. ZoneSense requires to reach a homeostasis with the intensity. The running interval example with 20x400m with 40 s recovery illustrates that the measurement does not indicate the harder running pace as interval duration is short with relatively long recovery. If the intervals would have been longer each interval would have reached an-aerobic intensity or if recovery would have been shorter the cumulative intensity impact would have been shown as in the previous example.
Higher Intensity Near Anaerobic Threshold
Half marathon
The following examples illustrate the ZoneSense in session where intensity is an-aerobic and reaches regularly an-aerobic threshold level. This example is from a half marathon race where recreational runner is pushing their own limits close to 1.5hours. The racecourse has some turns and hills, which impact on the intensity effort that athlete is working. The ZoneSense shows the intensity at an-aerobic effort in yellow with several sections shown at red in vo2 range. When comparing the black line illustrating the pace, one can observe a slight gradual decline of the pace. Similarly, one can see slight decline in heartrate. However the ZoneSense illustrate the yellow & red sections as athlete has tried to keep the intensity as high as possible.
Ice hockey with various effort spikes.
Its common method for endurance sports athletes to do a performance test in laboratory to establish the aerobic and an-aerobic levels as heart rate, pace or power. But for many sports this is not possible as the laboratory protocols do not represent sport in real life. Here is an example of an ice hockey game where players have been using ZoneSense to measure their effort during the game. Each work effort is shown as an-aerobic work where spikes in VO2max area.
For team sports such as ice hockey, football, basketball its very difficult to understand the real intensity levels as laboratory test done in treadmill or exercise bike doesn’t truly correlate to the effort in the field. ZoneSense could be a solution for some of these sports or training sessions for these athletes.
The challenge with ZoneSense is the requirement for constant work. Effort that leads to homeostasis a.k.a. balance needs to be long enough to DDFA index truly represent the intensity of the work. With many team sports and racquet sports, this can be a limitation with very short work durations and long rest periods. However, even if the games themselves couldn’t be measured with ZoneSense the training sessions with enough cumulative work could potentially be applicable for ZoneSense. This would be the long waited intensity measurement in team sports.
Muscle fatigue impact
ZoneSense is measuring stress with heart rate variability. This stress effect correlates to metabolic state of the body, where less stress is aerobic, and more is an-aerobic. However, the metabolic state is not the only effect but can be induced with other stress factors. Here is a test example where an athlete has done two ramp up protocols with ergometer in one workout. The first part can be seen from 8min-16min and the second at 1h 15min – 1h 23min. The middle part of the session was strength training heavy leg exercises. The impact of fatigue in leg muscles can be witnessed on the ramp up protocol where ZoneSense reaches a higher intensity range compared to the first version. The impact is not massive, but still illustrates the other stressful factors.
By measuring the actual response of the heart to workout intensity, ZoneSense offers athletes a reliable and daily tool to optimize their training across different sports. This technology is set to revolutionize how athletes understand and manage their physical stress levels, enhancing performance and recovery.
A similar impact of muscle load and potential different intensity levels can be found in the hiking session. The steep uphill and downhill make the workout become an-aerobic. Where the heartrate itself especially in downhill wouldn’t indicate this. The muscle fatigue and stress associated raises the ZoneSense intensity.


Training Intensity in Endurance Sports
The Importance of Training Intensity in Athletic Performance
Training intensity is a cornerstone of athletic conditioning, playing a pivotal role in enhancing performance. The intensity in endurance sports refer to metabolic state of the athletes body, do you currently work aerobically or an-aerobically. Understanding the intensity in each workout allows for tailored training programs that target specific energy systems and performance goals. By manipulating intensity, athletes can achieve peak performance and gain a competitive edge. Training intensity is not about working hard; it's about working smart. Recovery workout needs to be easy aerobic or harder sessions around an-aerobic threshold. Each workout is defined by intensity and duration. However the challenge is to know each day, what is easy today or do I go too hard in my intervals.
Aerobic and An-aerobic Thresholds
The aerobic and anaerobic thresholds have been instrumental in refining training intensity. The aerobic threshold marks the exercise intensity at which the body can sustain energy production primarily through aerobic metabolism, with minimal lactate accumulation. Training at or just below this threshold enhances endurance and the efficiency of energy systems. The anaerobic threshold (AT) or lactate threshold (LT) signifies the point where lactate begins to accumulate faster than it can be cleared, indicating a shift to more anaerobic energy production. Training at or slightly above this threshold improves an athlete's ability to sustain higher intensities and delays fatigue.
Measuring the intensity
Over the past decades, the measurement and understanding of training intensity have evolved significantly. Initially, subjective measures like the Rating of Perceived Exertion (RPE) were widely used, providing a simple yet effective way for athletes to gauge their effort levels. However, as sports science advanced, more objective methods were developed. These include heart rate monitoring, power output (in cycling and rowing), and pace (in running and swimming), which offer precise quantification of intensity.
Heart rate as intensity metric
Heart rate monitoring has long been a valuable tool for gauging workout intensity, providing a non-invasive and straightforward method for athletes to assess their effort levels. The heart rate corresponds to the body's demand for oxygen and energy during exercise; as intensity increases, so does the heart rate. However, heart rate alone doesn’t tell the “actual intensity”. Running with heartrate 150 can be aerobic or an-aerobic. As the intensity refers to athlete’s state of the body, am I working aerobically or an-aerobically, heart rate measurement is just not enough.
This has been one of the key challenges for wearable industry. Personal aspect of the heartrate. One athlete can run aerobically with heartrate of 160 and where the other one with same heartrate is over an-aerobic threshold. The heartrate value as such doesn’t tell what the actual intensity in terms of body metabolic state is. Therefore, there is various zone-based equations that try to help consumers to set the right levels. This is extremely difficult as each person’s body works differently and different sport have different intensity levels.
Finding the truth from the lab
This is where laboratory testing comes into play. Lab testing tries to measure direct biochemical markers to analyze transition from aerobic to anaerobic metabolism, offering a more precise determination of the appropriate intensity levels for training. This is usually done by measuring blood lactate concentrations at incremental exercise intensities.
The lactate threshold (LT) is most common way to define the an-aerobic threshold, but it is influenced by numerous factors, including individual fitness levels, metabolic responses, and exercise modalities. Different methods allow for flexibility in measurement based on the available equipment, the specificity of the sport, and the precision required for the intended use. Some methods are more suited for laboratory settings, while others can be applied in the field. As scientific understanding of LT evolves, new methods are developed to reflect the latest insights into how lactate behaves in the body during exercise.
The different methods also highlight the challenge of defining the anaerobic threshold for each individual athlete. In the end, for the athlete to get the right intensity levels, depending of the testing protocol, laboratory, and personnel the results can be very different. This was illustrated with the research article on one graph where various lactate threshold methods were defined for one test dataset. The range of results were massive, where result of threshold could have been between 243 watts to 338watts. The graph shows each method as a circle on the lactate curve and the number after the method with the resulting power number.
Picture from the article the anaerobic threshold: 50+ years of controversy by David C et all (3), illustrates the different methods to evaluate the lactate threshold in one graph.
Getting the lab results to field
There are several challenges to utilize the lab results in daily training. These are due to several factor.
Differences in Sports Different sports have different intensity levels. Doing the lab testing in running treadmill or cycling ergometer doesn’t mean that these intensities could be used when cross country skiing or playing soccer. This creates a challenge where the measurements in test protocol doesn’t reveal the actual intensity levels athletes would use in specific sport they might use part of their daily training.
The type of sport has different intensities influenced by the muscle mass involved, the movement pattern, the biomechanics, the energy system contribution, and the environmental conditions.
For example, running involves more muscle mass and eccentric contractions than cycling, which can increase the lactate production and decrease the lactate clearance.
Swimming involves more upper-body muscles and a horizontal position than running and cycling, which can alter the blood flow and the gas exchange.
Rowing involves both upper- and lower-body muscles and a variable stroke rate and power output, which can affect the lactate kinetics and the oxygen uptake.
Below is an example of research Differences between Treadmill and Cycle Ergometer Cardiopulmonary Exercise Testing Results in Triathletes and Their Association with Body Composition and Body Mass Index by Szymon et al. [2] that highlights the difference between running and cycling intensity levels. The highlighted values illustrate a 13-heartbeat average difference in research participants in cycling vs. running. Similarly, this illustrates 6 heartbeat average difference between participants. (2)
Therefore, it is important to evaluate and identify the intensity levels for each specific sport, rather than using a general value or transferring the value from one sport to another. Moreover, it is important to consider the sport-specific factors, such as the technique, the equipment, conditions such as terrain, the air or water temperature, and the wind, that can affect the the predefined intensity levels.
Daily Variations
Over time, an athlete’s anaerobic threshold can change due to training adaptations. As the body becomes more conditioned, the threshold may increase, requiring the athlete to adjust their training intensity to continue improving.
The common challenge in intensity measurements are the environmental aspects. If you run in heat, you will expect the heartrate being 10-20 beats higher than usual. This makes is extremely difficult to know if you are still in desired intensity level. Similar challenges are if you measure the intensity with running pace and will be running in technical terrain or winter time in zone. The measurement is not relevant. Altitude can also throw the heartrates of by 10-20 beats.
An athlete's physical condition can vary from day to day due to factors such as sleep, nutrition, stress, and recovery status. The daily personal variation – are you a evening or morning person, will impact the performance within the day. These daily fluctuations can affect the anaerobic threshold, making it difficult to maintain consistent training intensities cross training sessions. These changes can be bigger even within one day.
Here is the research In Athletes, the Diurnal Variations in Maximum Oxygen Uptake Are More Than Twice as Large as the Day-to-Day Variations by Knaier R et l [4] illustrating a change of Vo2max during different times of the day of research participants. In this research it was possible to see mean difference in VO2max
Diurnal variation: 5.0 ± 1.9 ml/kg/min
Day-to-day variation. 2.0 ± 1.0 ml/kg/min
To quantify the meaning the difference of 5ml/kg/min could mean a ~10-15min difference in marathon run or ~10-15s/km difference in running pace. This in practice could meant that athlete training in Zone 3 is actually training in Zone 5.
Variation of the % of Vo2max during day from – In Athletes, the Diurnal Variations in Maximum Oxygen Uptake Are More Than Twice as Large as the Day-to-Day Variations by Knaier
Intensity During Long Workouts
During prolonged workouts, the experience “intensity” of the work will shift due to fatigue and the accumulation of metabolic byproducts like lactate. This can make it challenging for athletes to gauge the correct intensity to train at for optimal performance. Research article Changes in the acid-base balance and lactate concentration in the blood in amateur ultramarathon runners during a 100-km run Jastrzębski Z et al. which was looking at the intensity based on heartrate, pace and lactate during a ultradistance running event. This illustrates the pace and heartrate “intensity metrics” getting step by step lower during the race. Athlete staring the rung with +10km/h or 78% from max hr win start to fade to 8.6km/h and 74% from max hr. Same time the lactate levels are increasing from 1.5 mmol/l gradually to 2 mmol/l and peaking in later stages to 3-4mol/range. This illustrates the challenge for the athlete to use the predefined intensity metrics in pacing in long efforts.
Changes in the acid-base balance and lactate concentration in the blood in amateur ultramarathon runners during a 100-km run Jastrzębski Z et al. The arrows has been added to graphs on this article.
Summary
Intensity refers in endurance sports to metabolic state. Is current effort aerobic or an-aerobic. Accurately determining the anaerobic threshold requires sophisticated equipment and testing protocols, which may not be readily available to all athletes. Field tests and estimations can provide some guidance but may lack the precision of laboratory assessments. The state of the body each day, difference in sports and other factors such heat, altitude or workout duration will impact the intensity level. This creates an obstacle for athletes to measure and monitor the intensity of the workouts in daily training. ZoneSense with the DDFA index tries to remove this obstacle.
(1) BENEKE, RALPH; von DUVILLARD, SERGE PETELIN. Determination of maximal lactate steady state response in selected sports events. Medicine & Science in Sports & Exercise 28(2): p 241-246, February 1996. https://journals.lww.com/acsm-msse/fulltext/1996/02000/determination_of_maximal_lactate_steady_state.13.aspx
(2) Differences between Treadmill and Cycle Ergometer Cardiopulmonary Exercise Testing Results in Triathletes and Their Association with Body Composition and Body Mass Index by Szymon Price 1,Szczepan Wiecha 2,*ORCID,Igor Cieśliński 2,Daniel Śliż 1,3,*ORCID,Przemysław Seweryn Kasiak 4ORCID,Jacek Lach 1,Grzegorz Gruba 4ORCID,Tomasz Kowalski 5ORCID andArtur Mamcarz 1ORCID Int. J. Environ. Res. Public Health 2022, 19(6), 3557; https://doi.org/10.3390/ijerph19063557
(3) Poole, D.C., Rossiter, H.B., Brooks, G.A. and Gladden, L.B. (2021), The anaerobic threshold: 50+ years of controversy. J Physiol, 599: 737-767. https://doi.org/10.1113/JP279963
(4) Knaier R, Qian J, Roth R, Infanger D, Notter T, Wang W, Cajochen C, Scheer FAJL. Diurnal Variation in Maximum Endurance and Maximum Strength Performance: A Systematic Review and Meta-analysis. Med Sci Sports Exerc. 2022 Jan 1;54(1):169-180. doi: 10.1249/MSS.0000000000002773. PMID: 34431827; PMCID: PMC10308487.
(5) Jastrzębski Z, Żychowska M, Konieczna A, Ratkowski W, Radzimiński Ł. Changes in the acid-base balance and lactate concentration in the blood in amateur ultramarathon runners during a 100-km run. Biol Sport. 2015 Sep;32(3):261-5. doi: 10.5604/20831862.1163372. Epub 2015 Jul 31. PMID: 26424931; PMCID: PMC4577565.
1 / 3